Integrating Telemetry2U with the Helium Network on AU915
This guide provides step-by-step instructions for connecting a Dragino LHT65 temperature and humidity sensor to the Telemetry2U platform via the Helium Network using the AU915 frequency plan. While the LHT65 is used as an example, the process applies to most LoRaWAN-compatible devices.
Getting Started with Telemetry2U and the Helium Network
Before connecting your LoRaWAN device to Telemetry2U via the Helium Network, there are a few things you'll need. This section outlines the essential accounts, hardware, and tools required to ensure a smooth and successful integration.
- A Telemetry2U account, either on a 14-day free trial or with an active subscription. See the Telemetry2U Quick Guide for help getting started.
- An active account on the Helium Console.
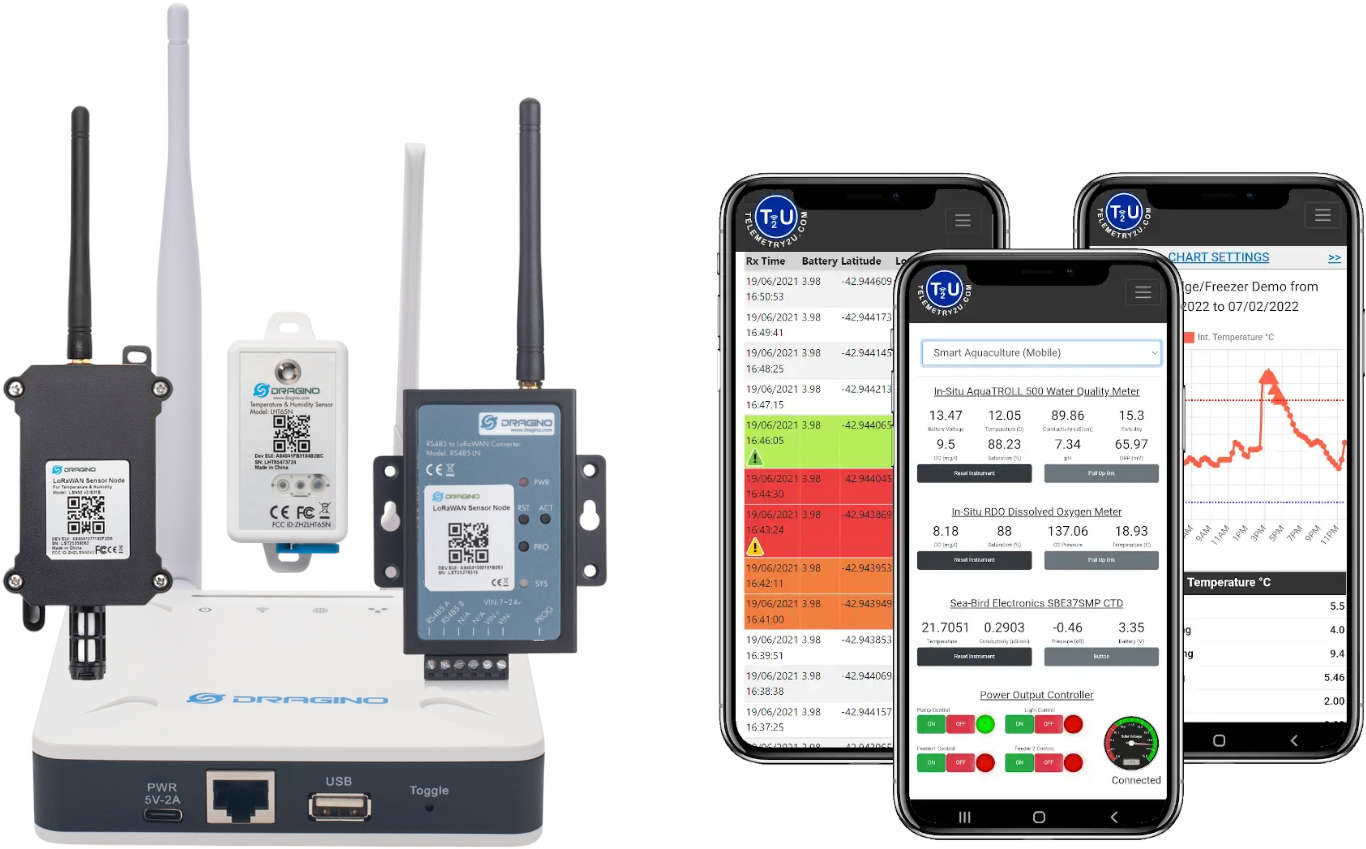
- A Dragino LHT65 or any other LoRaWAN-compatible device, running the latest firmware. A USB-Serial converter is also required for configuration.
- Adequate signal coverage within range of the Helium Network.
Dragino LHT65 Configuration for Telemetry2U and Helium
Before you begin, you’ll need to manually connect to the LHT65 using a terminal program such as RealTerm or PuTTY. While detailed instructions are available in the LHT65 user manual, here’s a brief summary:
- Connect the LHT65 to your PC via a USB-Serial converter.
- Start a serial session at 9600bps.
- Send the password 123456 to initialise communication.
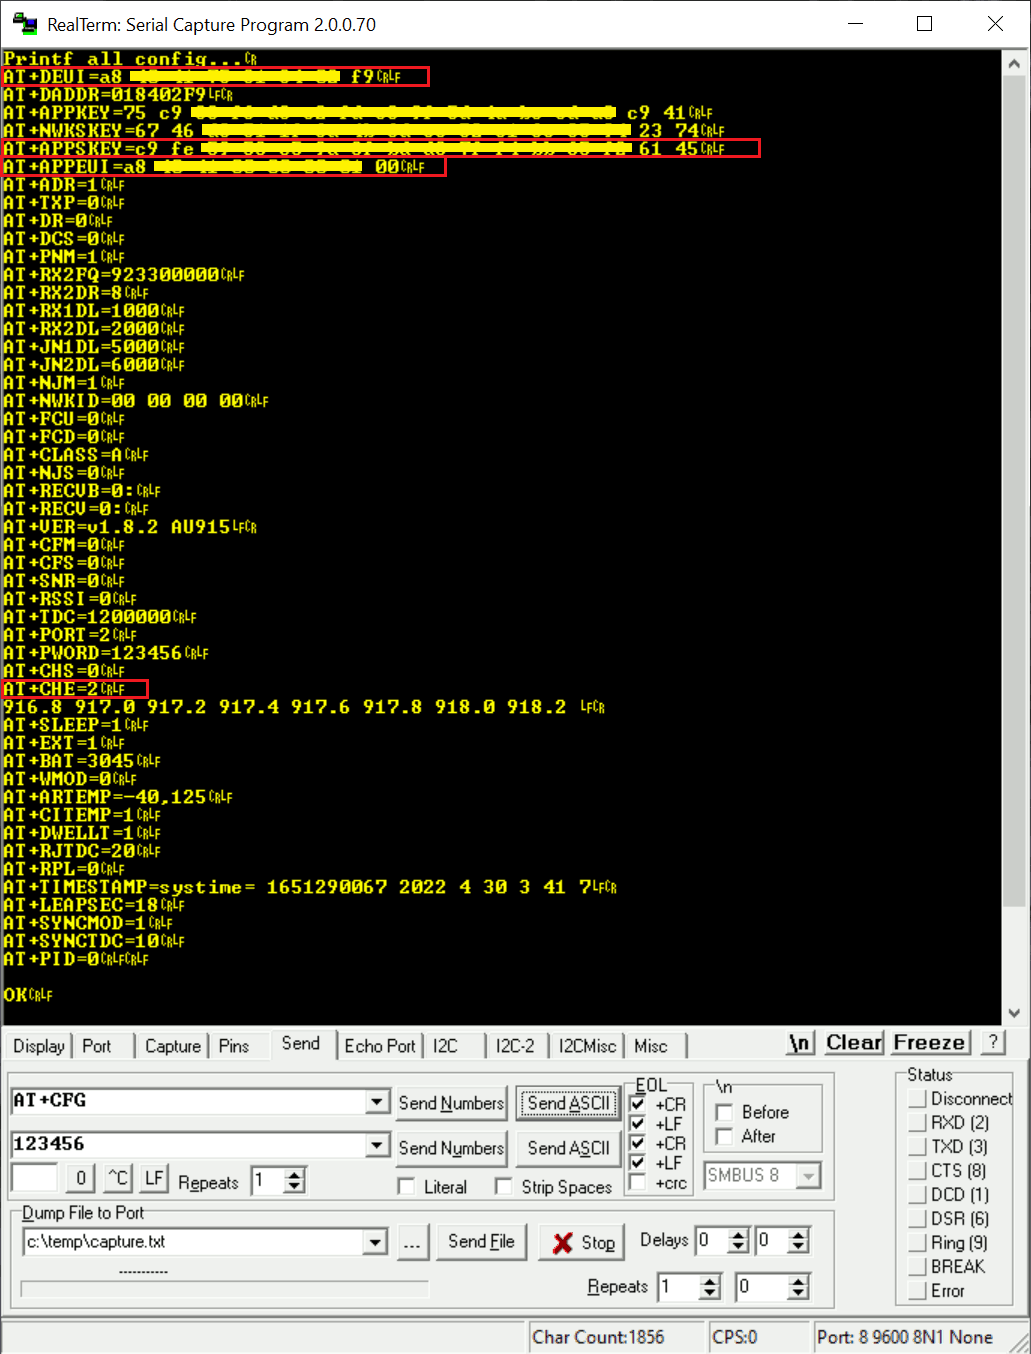
- If successful, send the command AT+CFG to view current device settings.
The Helium Network uses 8 channels on sub-band 2 (SB2) of the AU915 frequency plan. By default, the LHT65 uses all 64 channels, which can cause unreliable connectivity. To configure the device for SB2, send the command AT+CHE=2. When prompted, reset the device by sending ATZ or holding the button for 5 seconds.
At this stage, you may also wish to adjust optional settings such as Adaptive Data Rate (ADR) and message confirmations. By default, ADR is enabled and message confirmations are disabled.
Once your configuration is complete, run AT+CFG again to verify that the settings have been applied correctly. Take note of the Device EUI (DEUI), Application EUI (APPEUI), and Application Key (APPKEY)—you’ll need these to register the device in both the Helium Console and on Telemetry2U. Although these details are printed on the device’s packaging, it’s easier and more accurate to copy them digitally at this stage.
Add Device to the Telemetry2U Platform and Helium Console
With your device configured, you now need to register it on both the Helium Console and the Telemetry2U platform. Using each platform’s web interface, you’ll enter the device credentials (DEUI, APPEUI, and APPKEY), set up the integration, and confirm data is flowing. This section guides you through the process using both consoles.
Registering Your LoRaWAN Device on the Telemetry2U Platform
Log in to Telemetry2U and navigate to Admin >> Node Maintenance, then click the Create New link in the top-left corner. Enter a unique name in the Description field and select AU915 as the Profile (or whichever option best matches your local Helium network). Enter the Device EUI retrieved earlier (or from the box label), and choose Helium as the Network Provider. Finally, select the appropriate Device Configuration—in this case, Dragino LHT65 Temperature Sensor V1.5.
Note:
If the required Device Configuration isn’t listed, you can create your own Payload Decoder and Downlink Commands as described in Sections 6.4.4–5 of our comprehensive user guide.
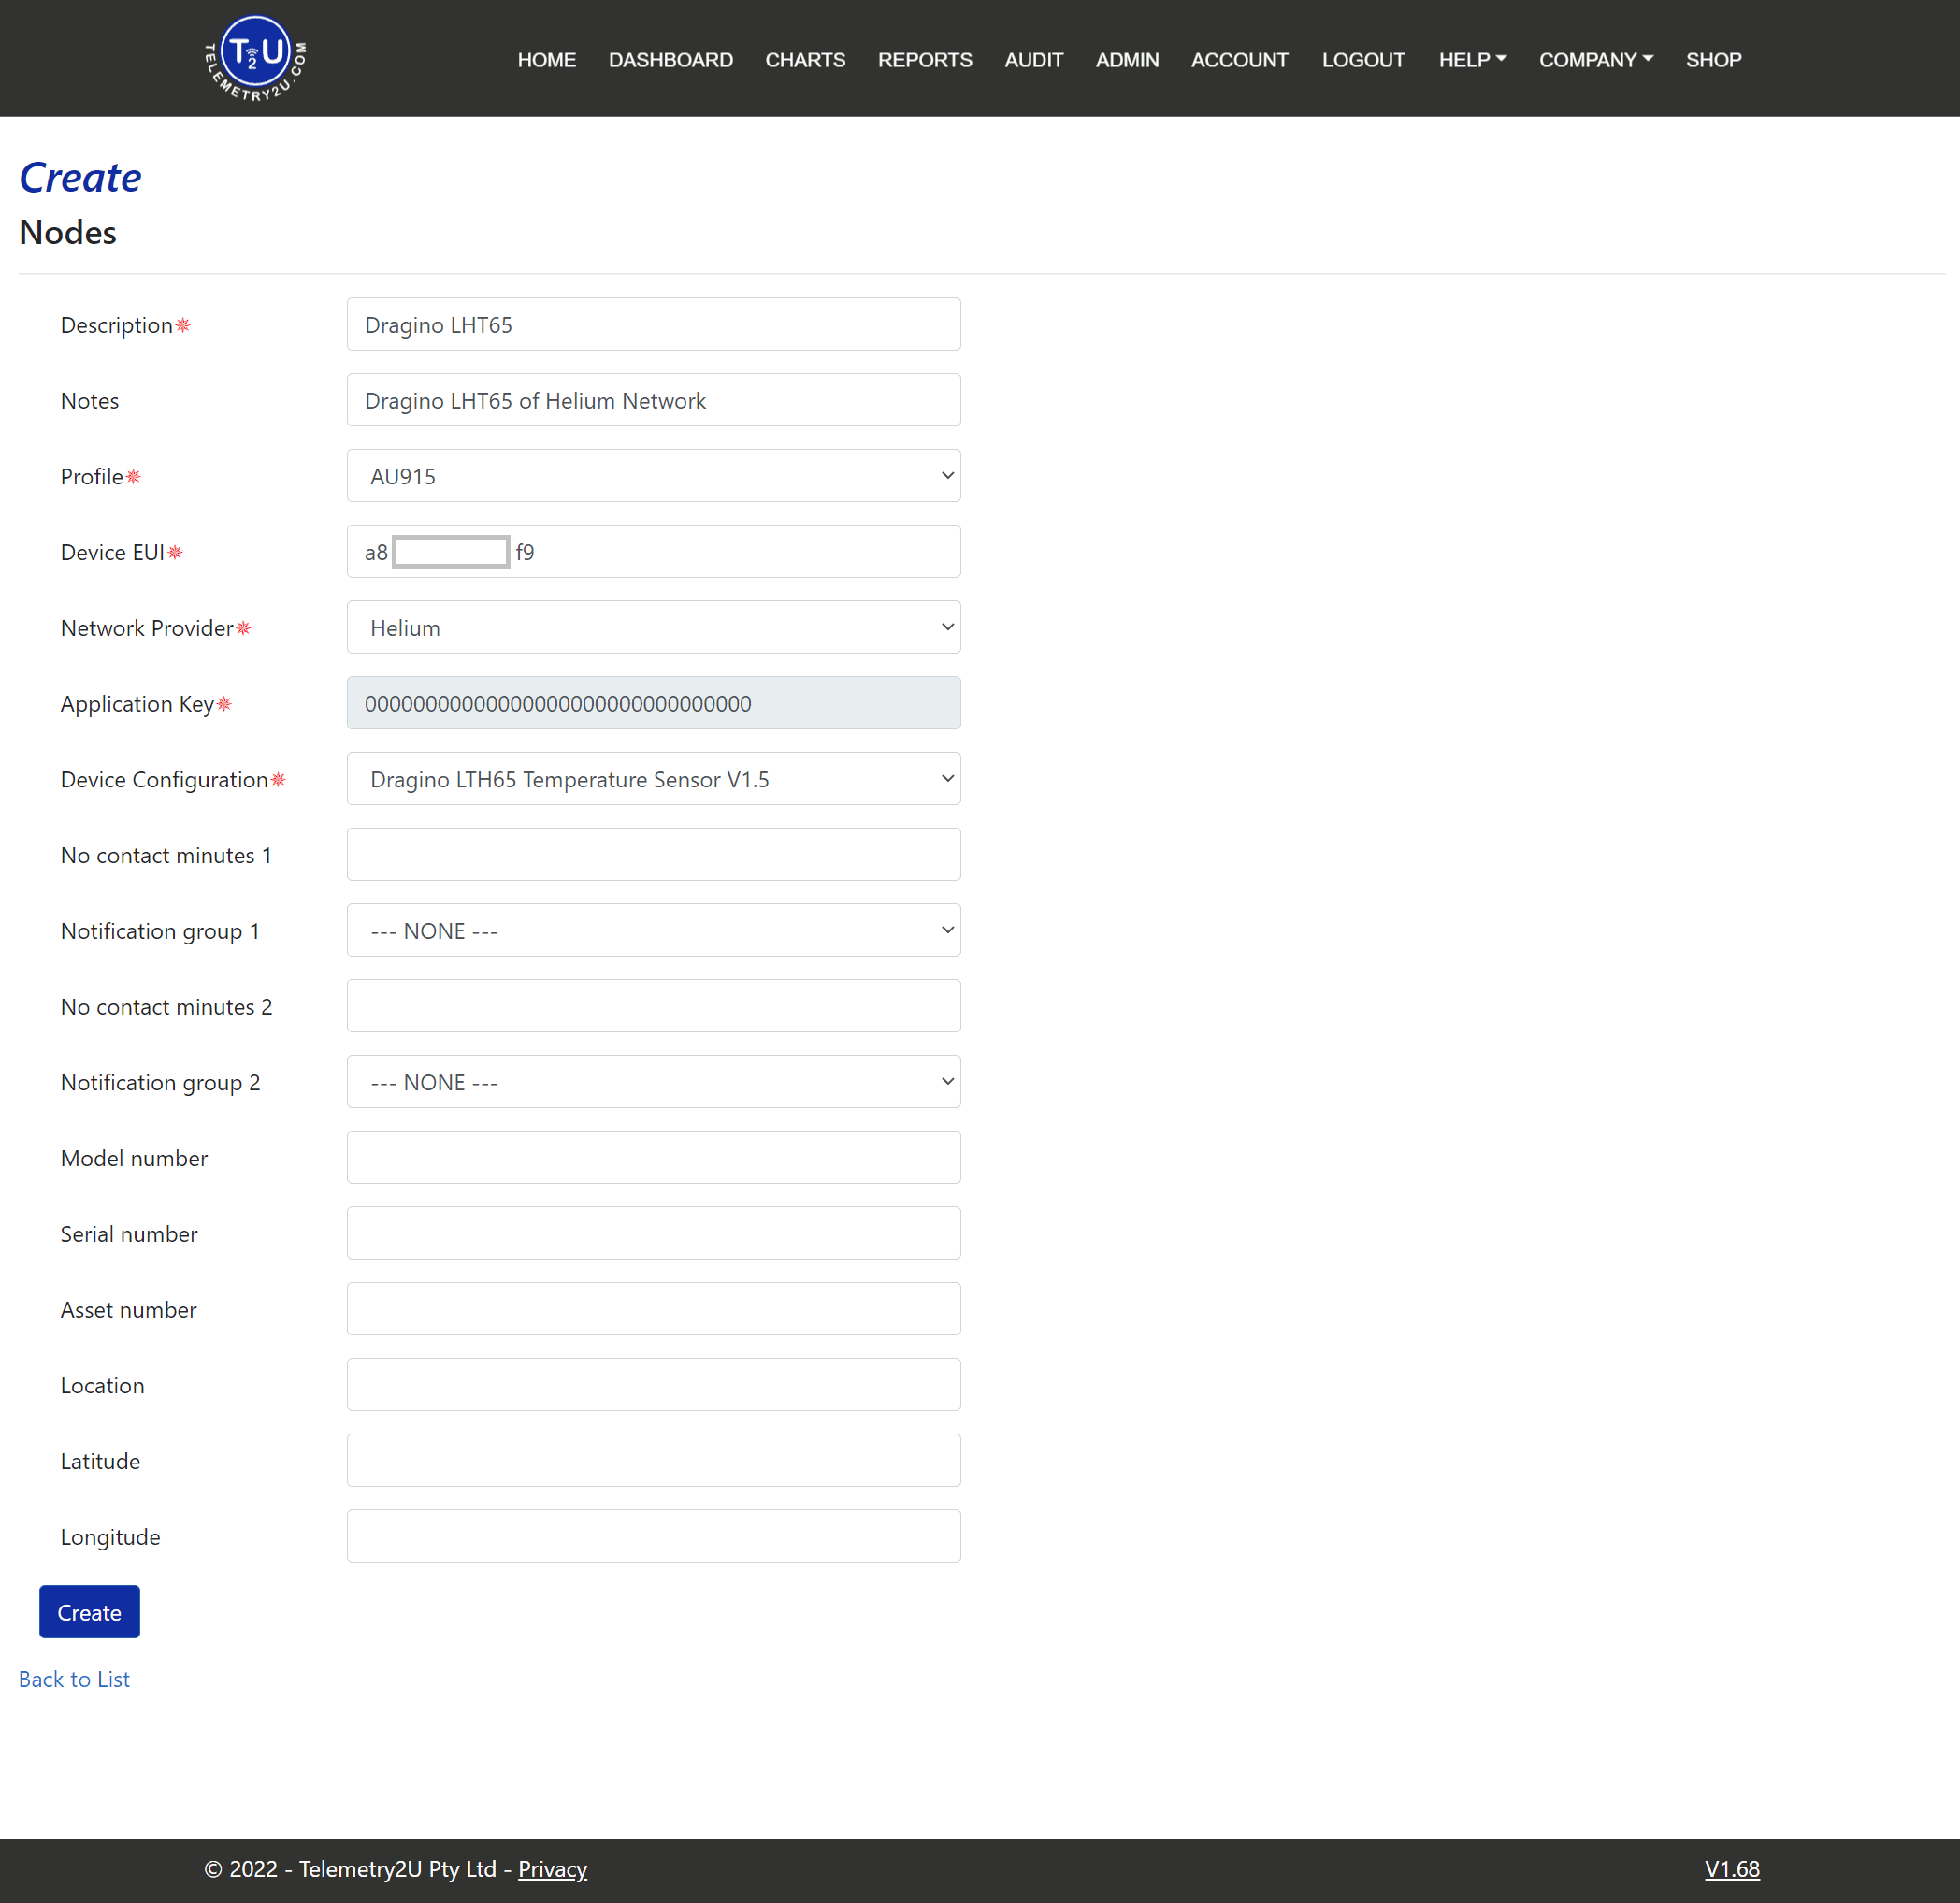
Click the Create button at the bottom of the page when finished.
Creating a Device Profile and Registering Your Device in the Helium Console
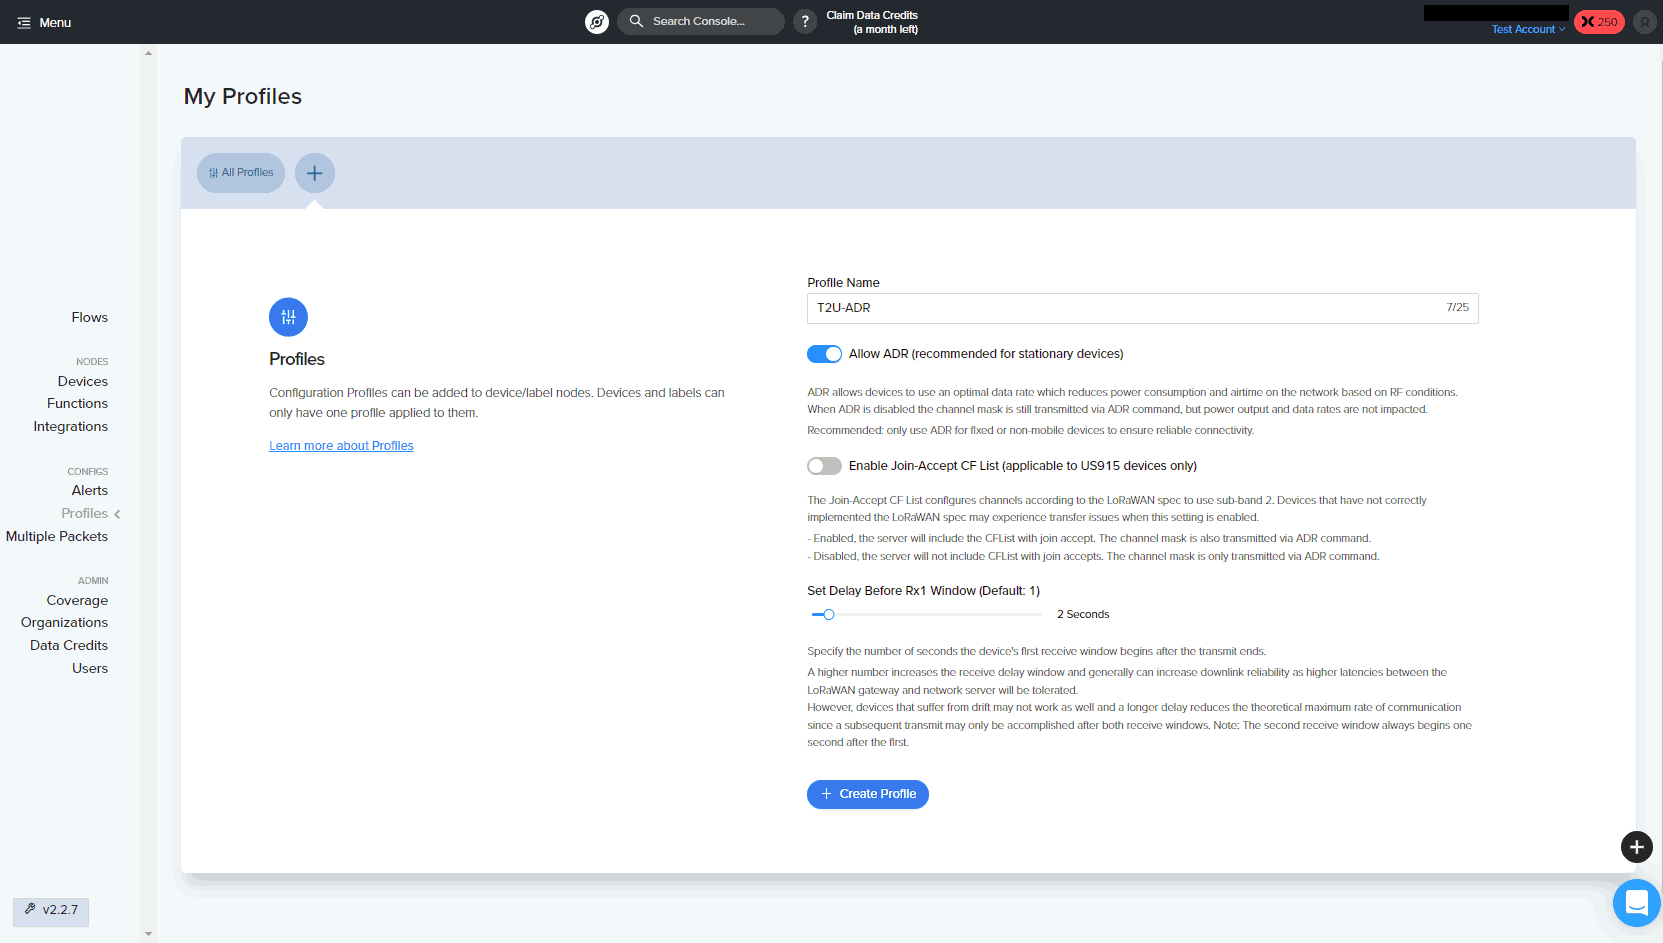
Before adding a LoRaWAN device to the Helium Console, it’s recommended to first create a Profile, which is required during device setup. The profile defines settings such as Adaptive Data Rate (ADR) and the delay before the Rx1 window.
Keep your Telemetry2U tab open and log in to the Helium Console in a new tab. From the sidebar, navigate to Profiles and click Add New Profile. Give the profile a unique Profile Name. If you enabled ADR during device configuration, tick the Allow ADR box. Unless you’re using the US915 band, leave Enable Join Request set to Off. The default Set Delay before Rx1 Window is 1 second, but Telemetry2U recommends setting it to 2 seconds to improve downlink reliability.
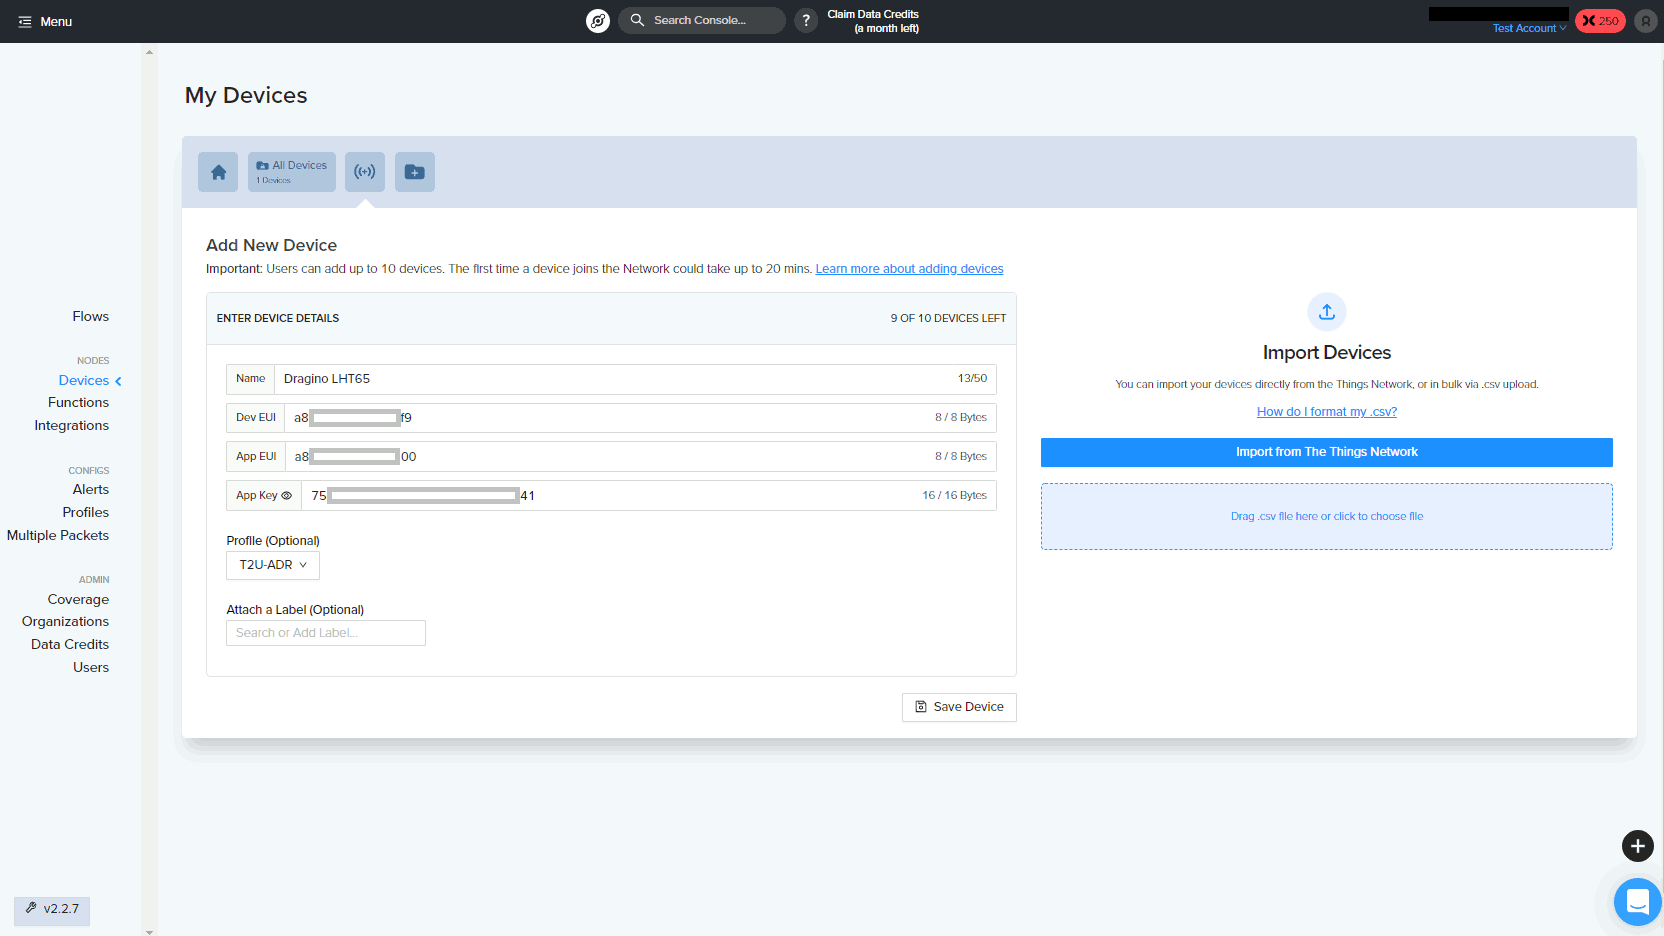
From the Helium Console, navigate to Devices and click the Add New Device button. Enter a unique Name and paste the Device EUI, App EUI, and App Key that you recorded earlier (or from the device packaging). Ensure all keys are entered without spaces. Click the Save Device button to finish. The device will display a "Pending" status for 15–30 minutes while Helium completes verification.
Setting Up an Integration Between Helium and Telemetry2U
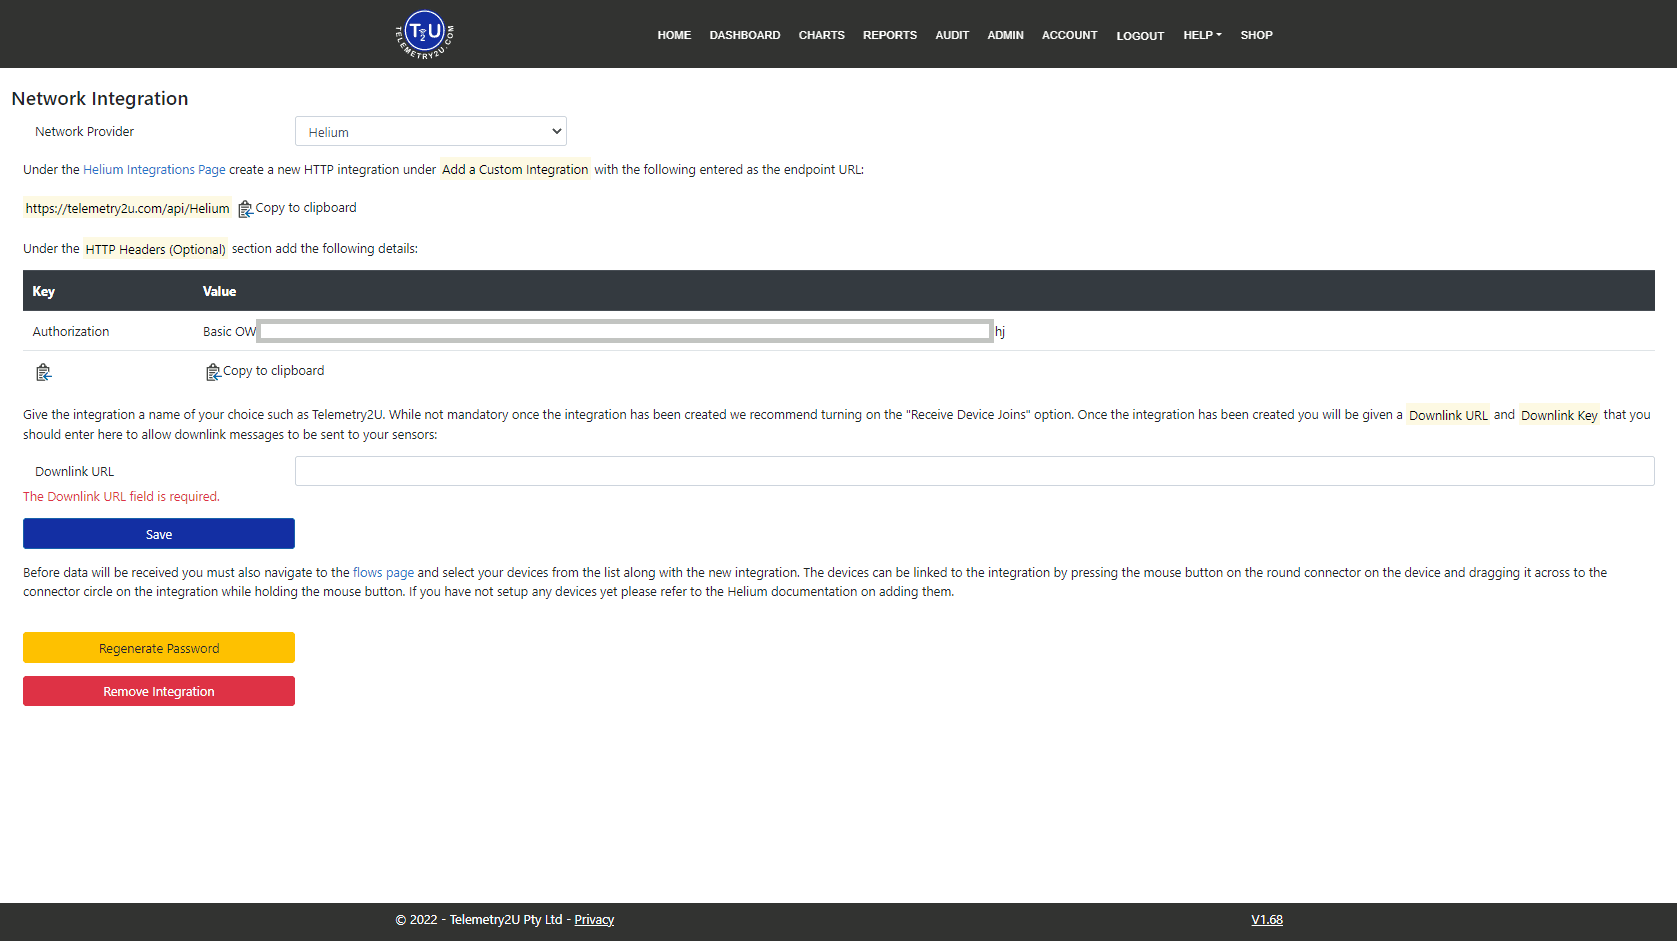
Return to the Telemetry2U tab and navigate to Admin >> Setup Integration. Select Helium as the Network Provider and click the Add Integration button.
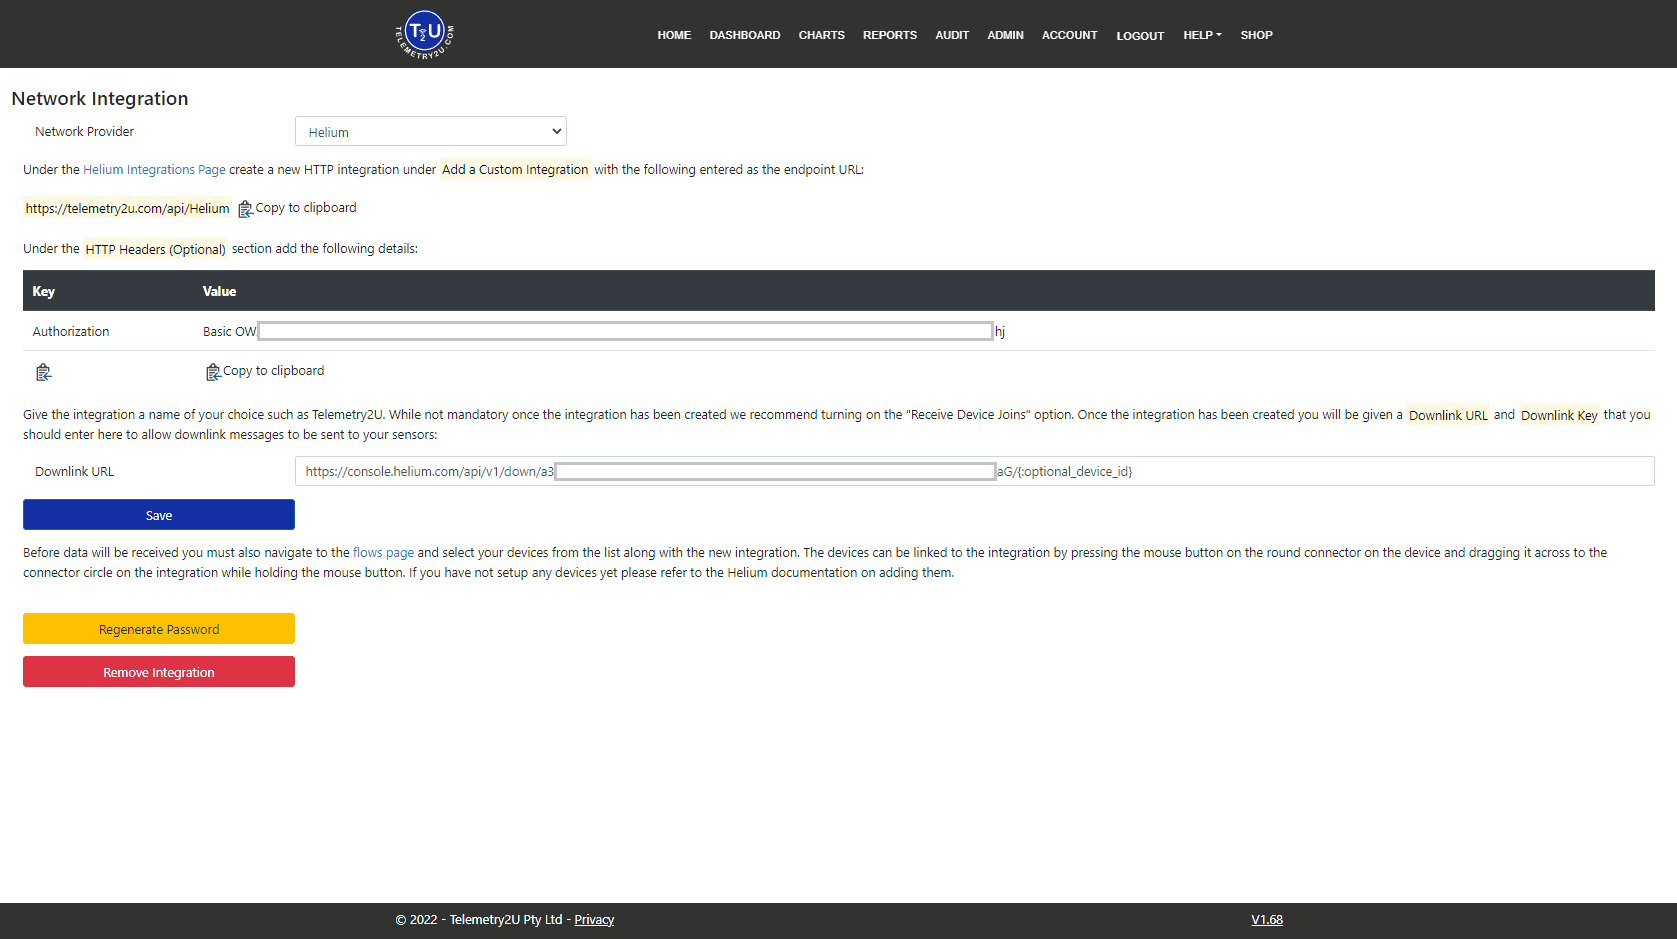
In the Helium Console, navigate to Integrations from the sidebar and click New Integration. Scroll to the Add A Custom Integration section and select HTTP.
Enter the Endpoint URL: https://telemetry2u.com/api/Helium (also found on the Telemetry2U integration page).
Add one HTTP Header: set Authorization as the Key, and paste the Value from your Telemetry2U integration page (it begins with Basic and includes about 100 characters). Click Add Header, name your integration, and click Add Integration.
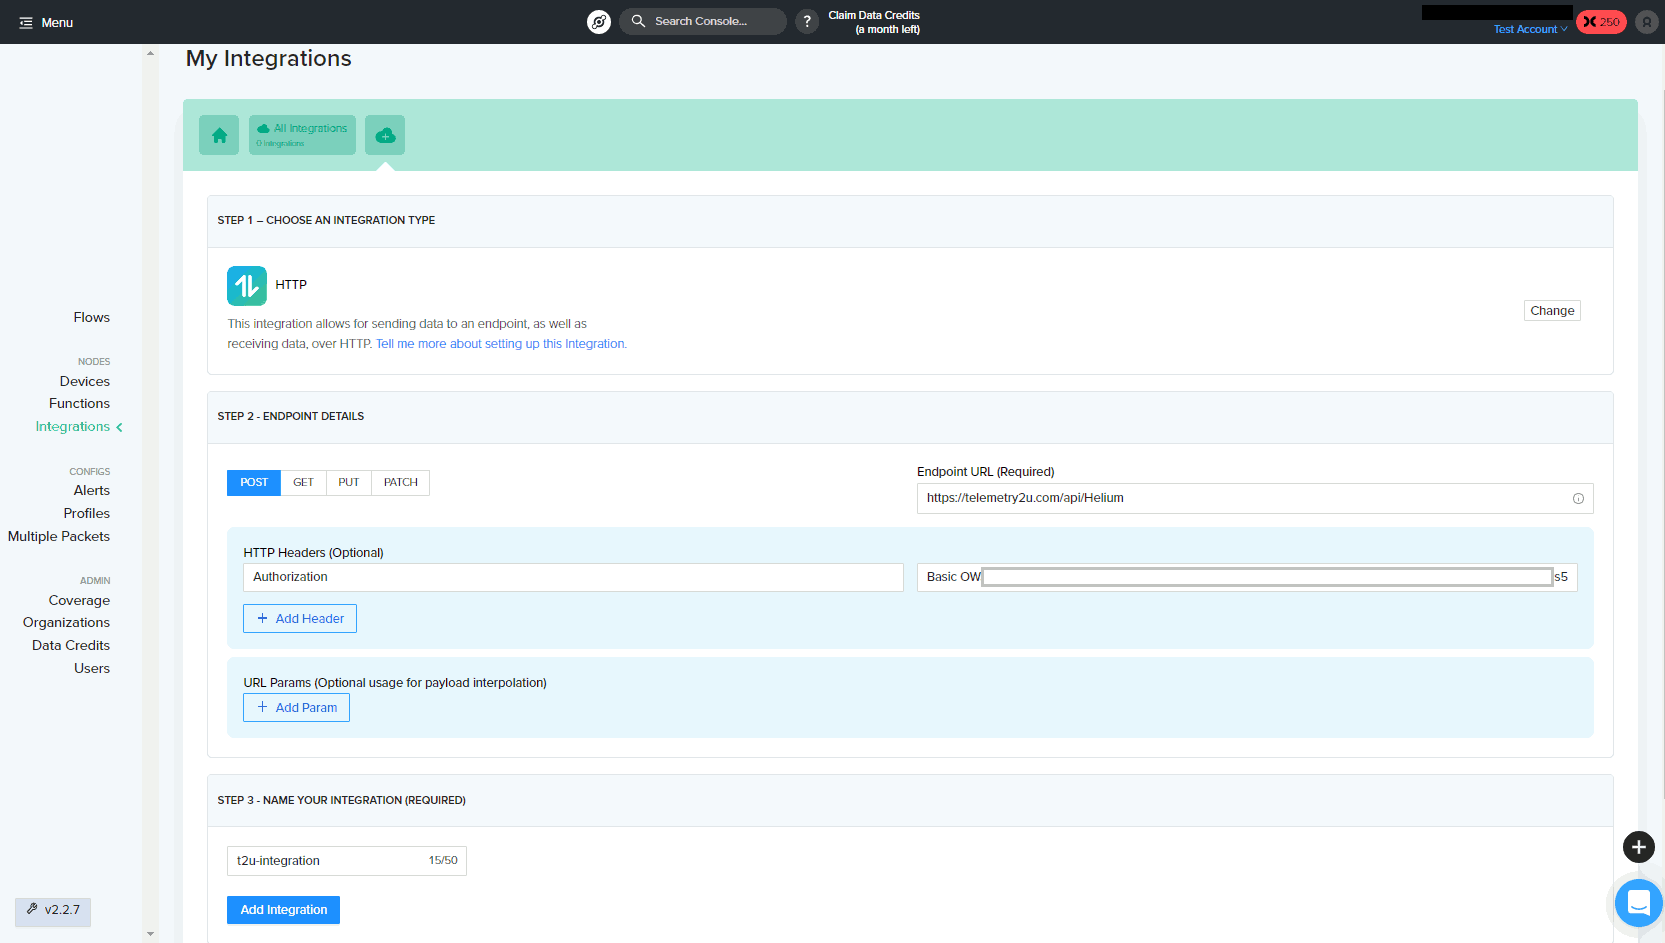
You’ll be taken to a new page showing the integration details.
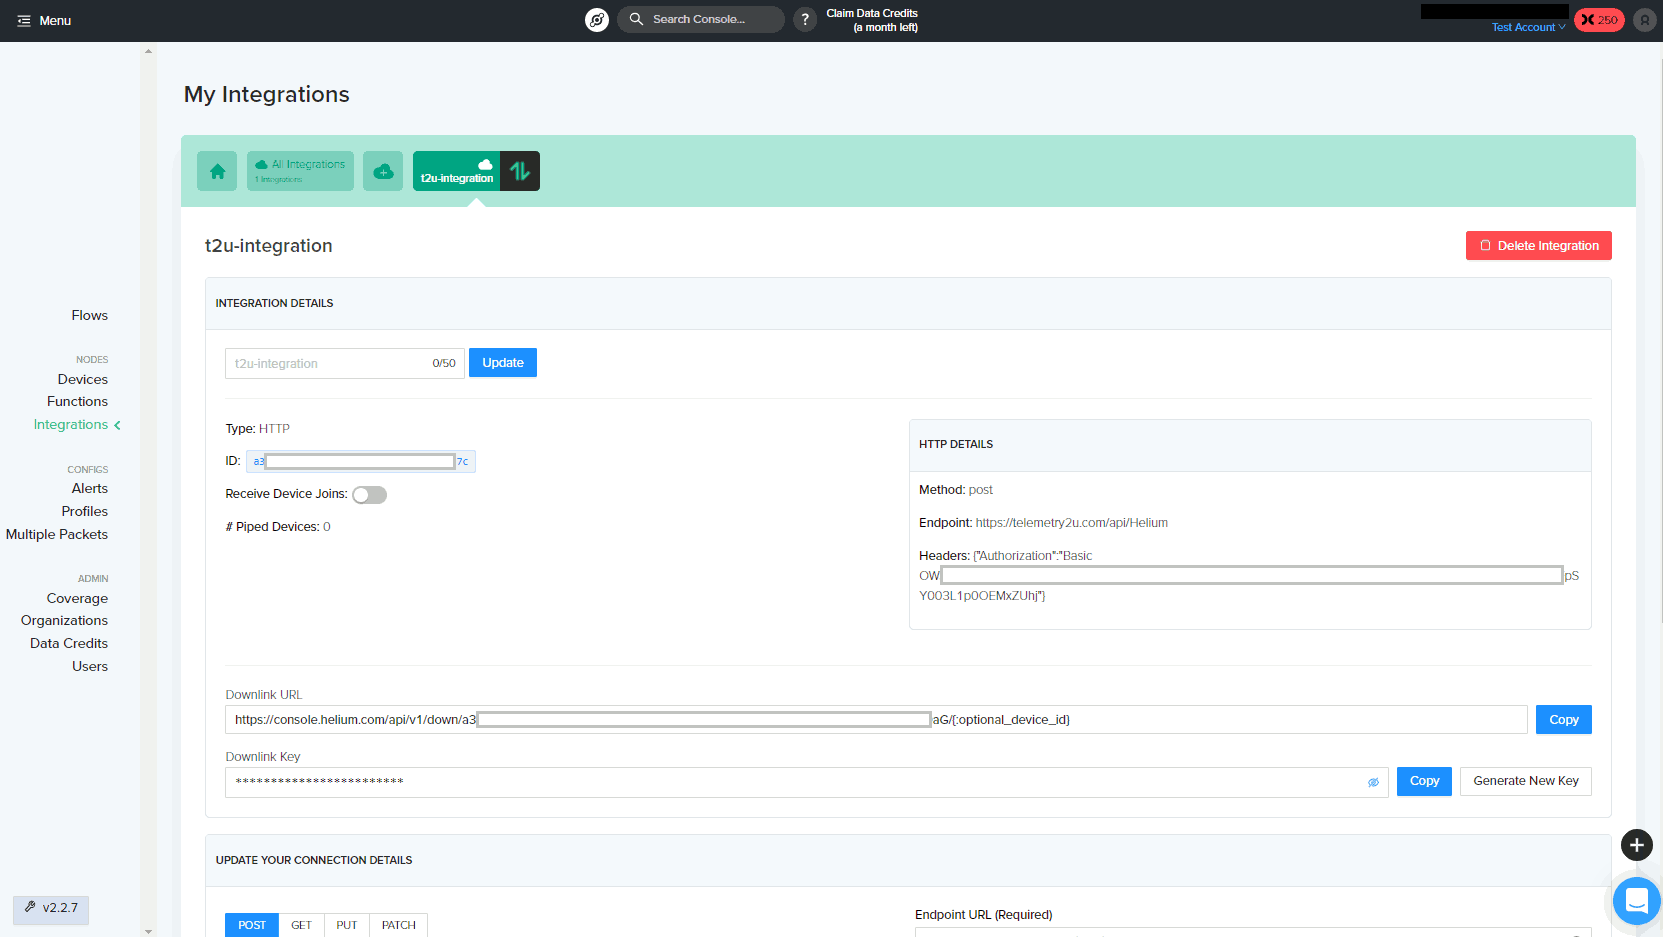
Copy the Downlink URL from the Helium Console and paste it into the Downlink URL field on the Telemetry2U integration page, then click Save.
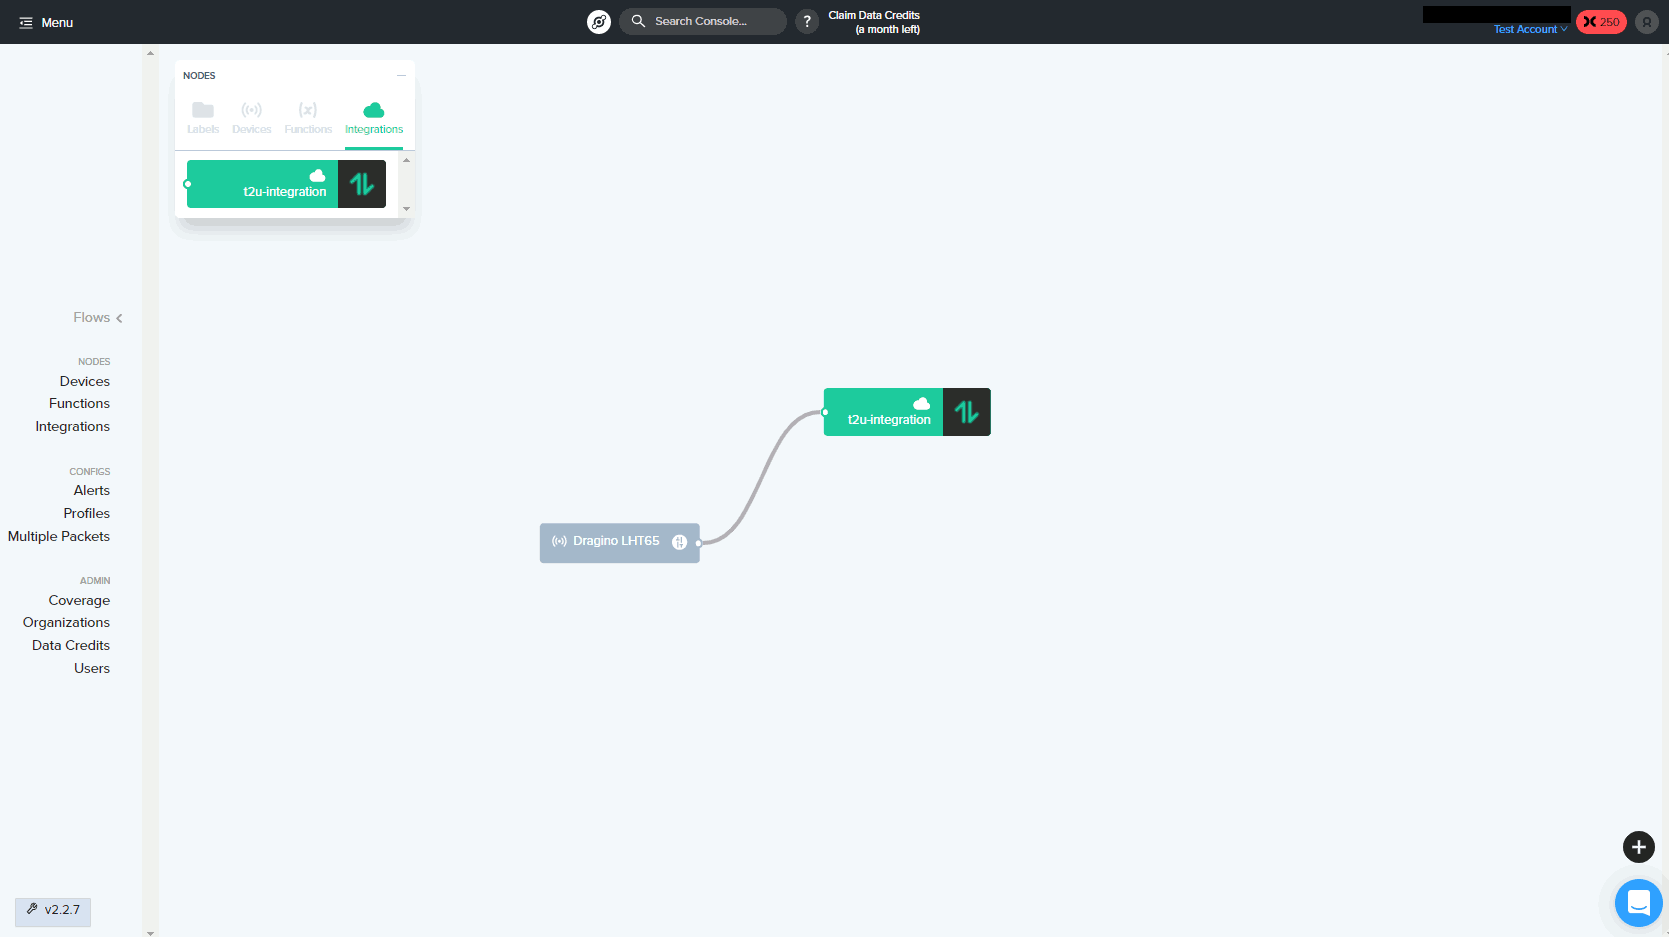
Building a Data Flow in the Helium Console
To complete the integration and begin receiving data in Telemetry2U, you'll need to create a Flow within the Helium Console.
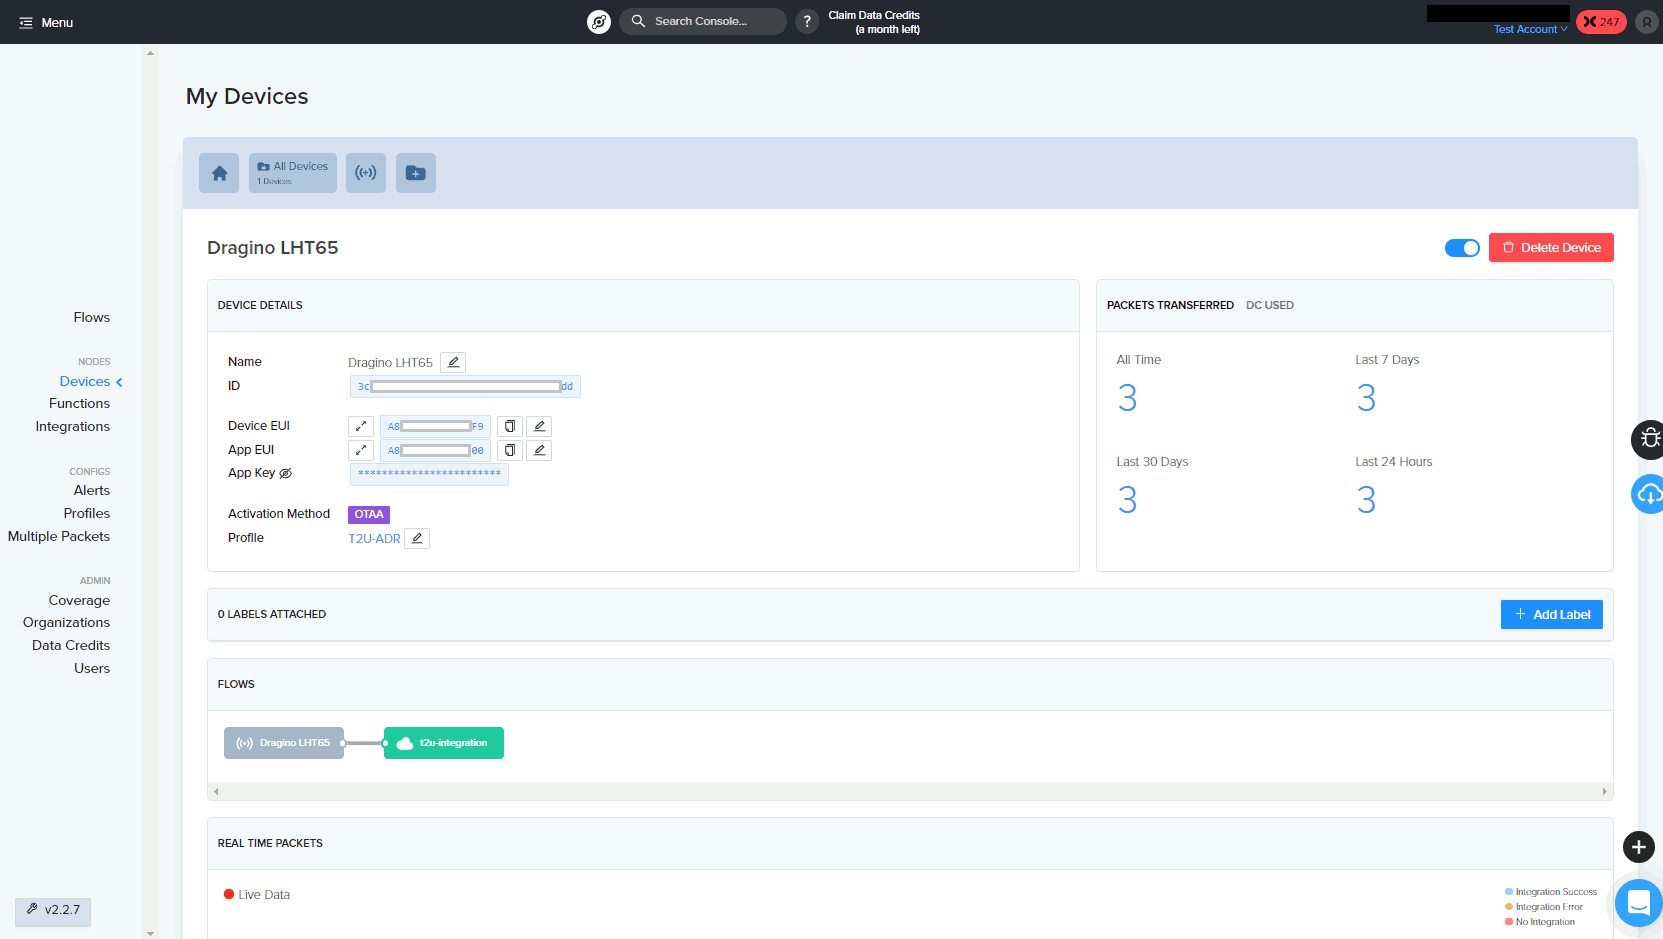
Go to the Flows section via the sidebar. From the top menu, add both a Device and an Integration, then drag them onto the main canvas. To connect them, click and hold the round connector on the device and drag it to the round connector on the integration. This links the two elements and completes the data path.
Verifying Data in Telemetry2U and the Helium Console
Congratulations — the integration between Helium and Telemetry2U is now complete.
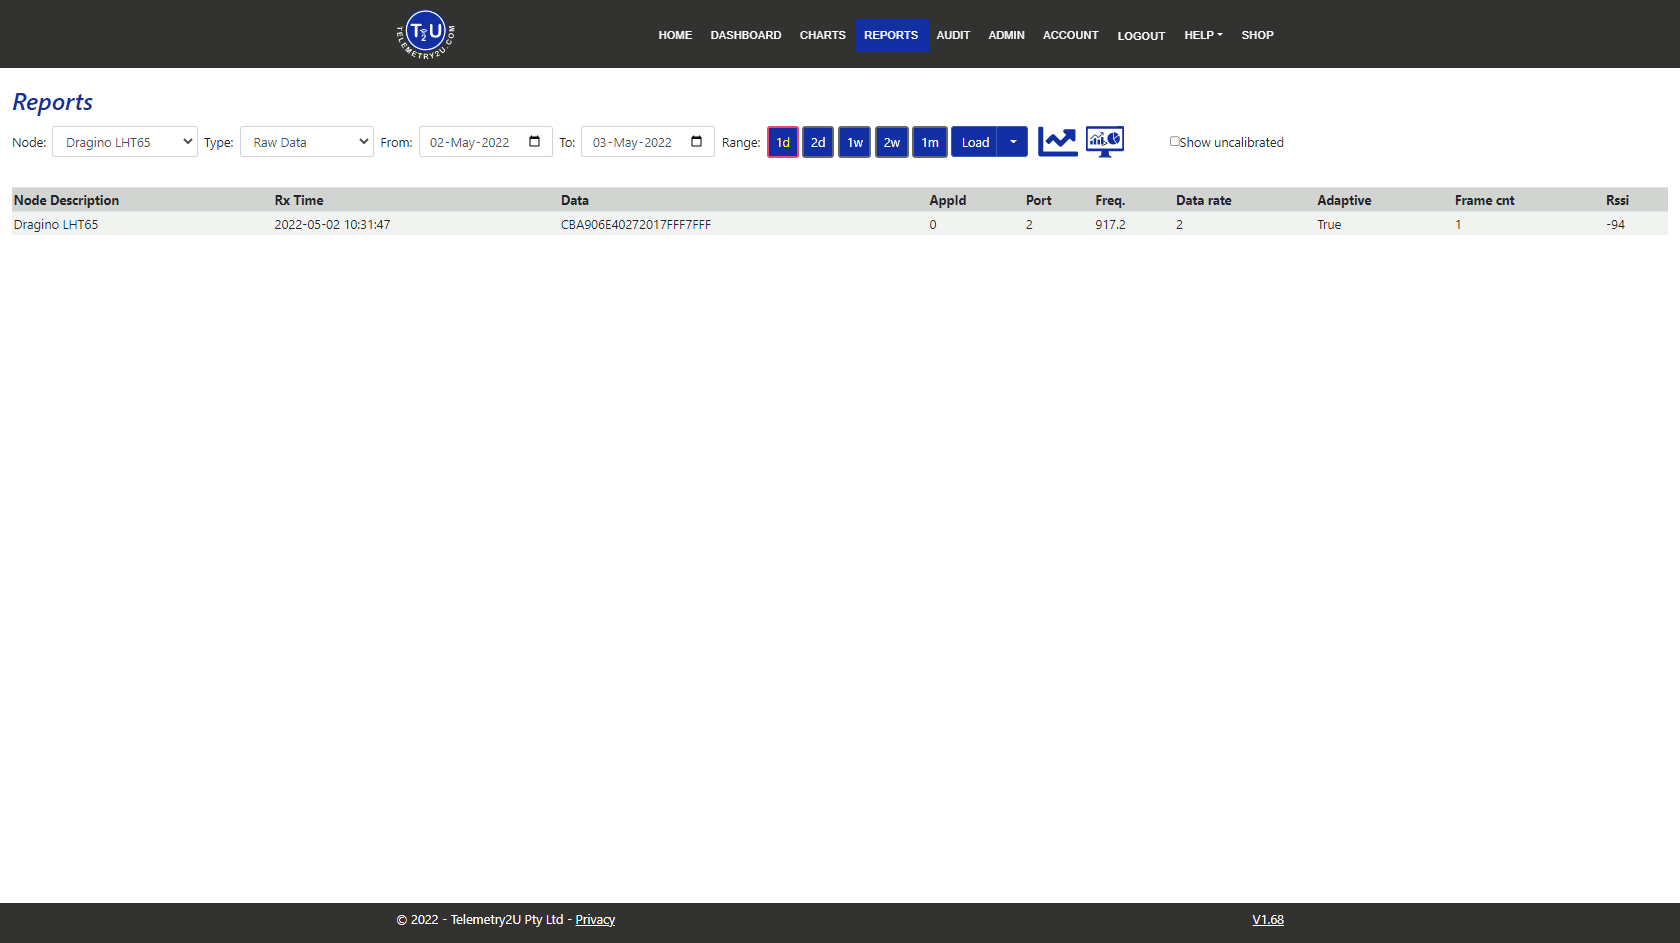
To confirm everything is working, go to the Reports page in Telemetry2U and check for incoming data from your device.
Note:
You can use the Raw Data option to monitor the Data Rate. ADR (Adaptive Data Rate) usually takes around 10 transmissions to adjust. The Raw Data view is also helpful for confirming that a sensor is working properly if no profile was selected during device setup.
Alternatively, go to the Devices page in the Helium Console to view device statistics and status. Refer to the Helium documentation for more detailed insights.