A working system can be very simple
For a basic deployment, connect one data source and confirm its readings. Everything else can be added later without rebuilding the system.
Connect the data source
LoRaWAN deployments need a gateway and device. NB-IoT and LTE-M devices connect directly, so you can start at the device section.
Notify the right people
Invite users, set their access, and create notification groups only when other people need platform access or alerts.
Extend the workflow
Add alerts, automated actions, audit reports, and dashboards in any order once the incoming data has been verified.
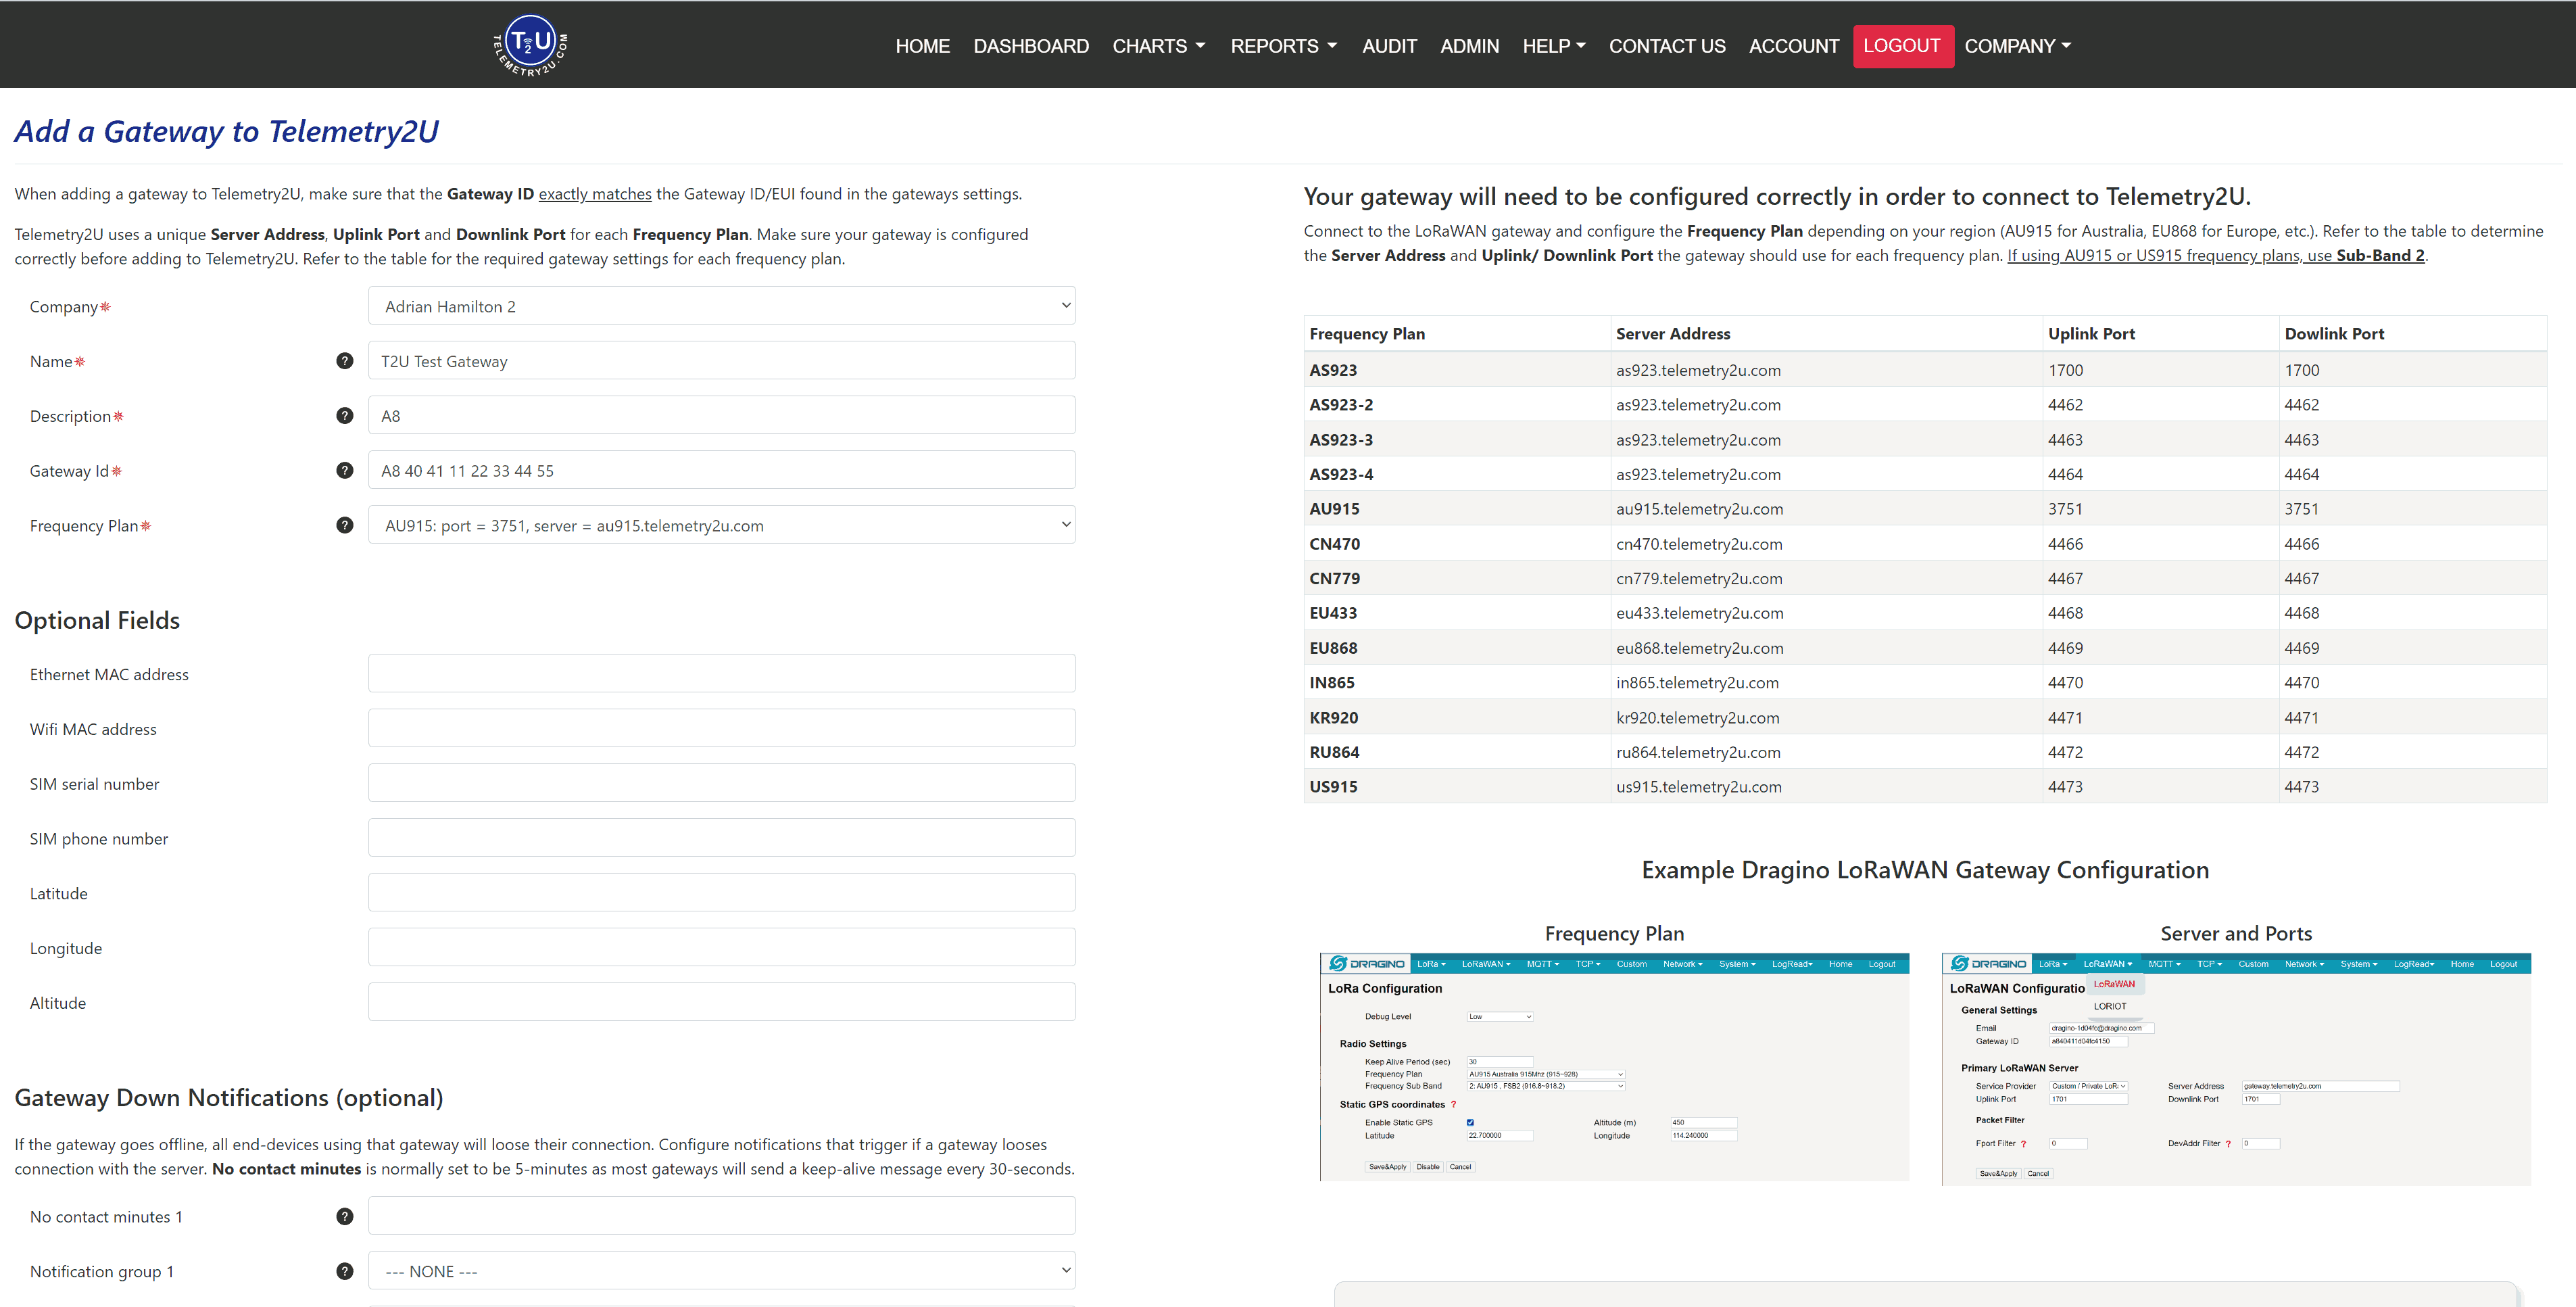
Connect a LoRaWAN gateway
Point the gateway to the platform, register its identifier, and confirm that it is online. Cellular devices do not require this section.
- Configure the gateway frequency plan for its region, such as AU915 in Australia or EU868 in Europe. For AU915 or US915, use Sub-Band 2.
- Enter the server address and uplink/downlink ports for the selected frequency plan. The gateway configuration bulletin below provides the current values and an example setup.
- Open Gateway Maintenance, add the gateway, enter its Gateway ID exactly, and select the same frequency plan.
- Open Gateway Status and confirm that the gateway is connected before adding devices.
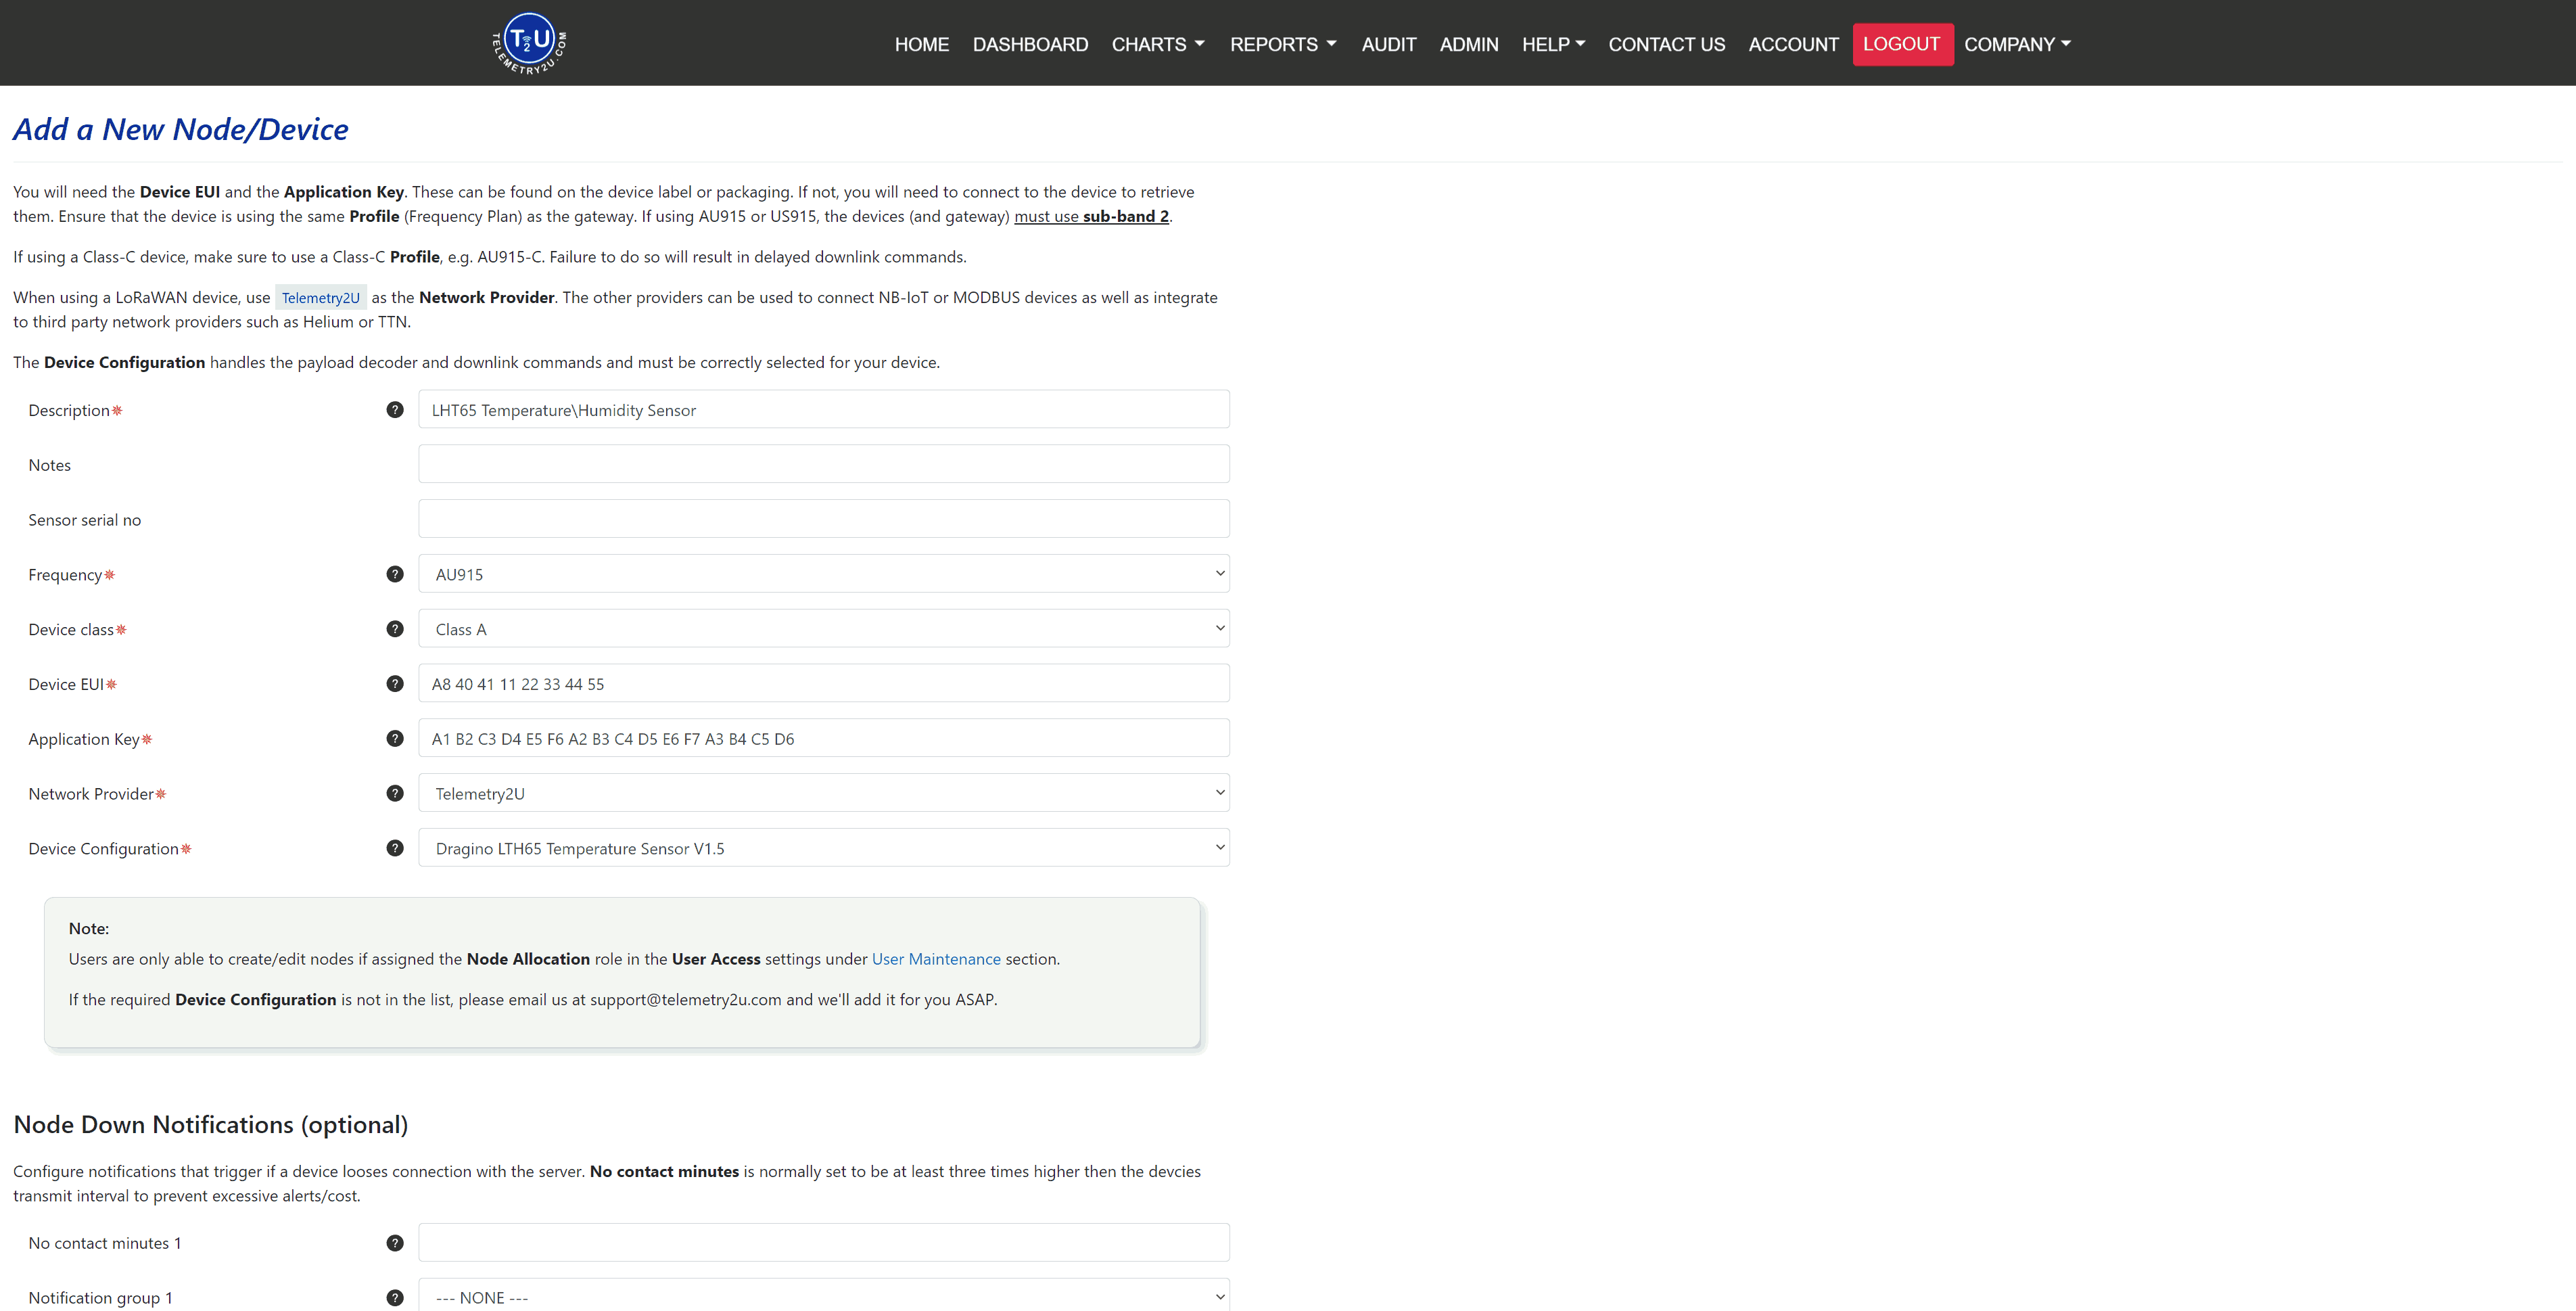
Add nodes and end devices
Register each LoRaWAN, NB-IoT, or LTE-M device and assign the correct device configuration so its payload is converted into usable sensor readings.
- Configure LoRaWAN devices to use the same frequency plan and sub-band as the gateway. Configure cellular devices with the required APN and server details.
- Open Node Maintenance and add the device. Enter the identifier and keys exactly as supplied by the manufacturer.
- Select the correct network provider, device class, and device configuration. For platform-hosted LoRaWAN, select Telemetry2U as the network provider.
- If the device is not listed, create a Custom Device or contact support for assistance.
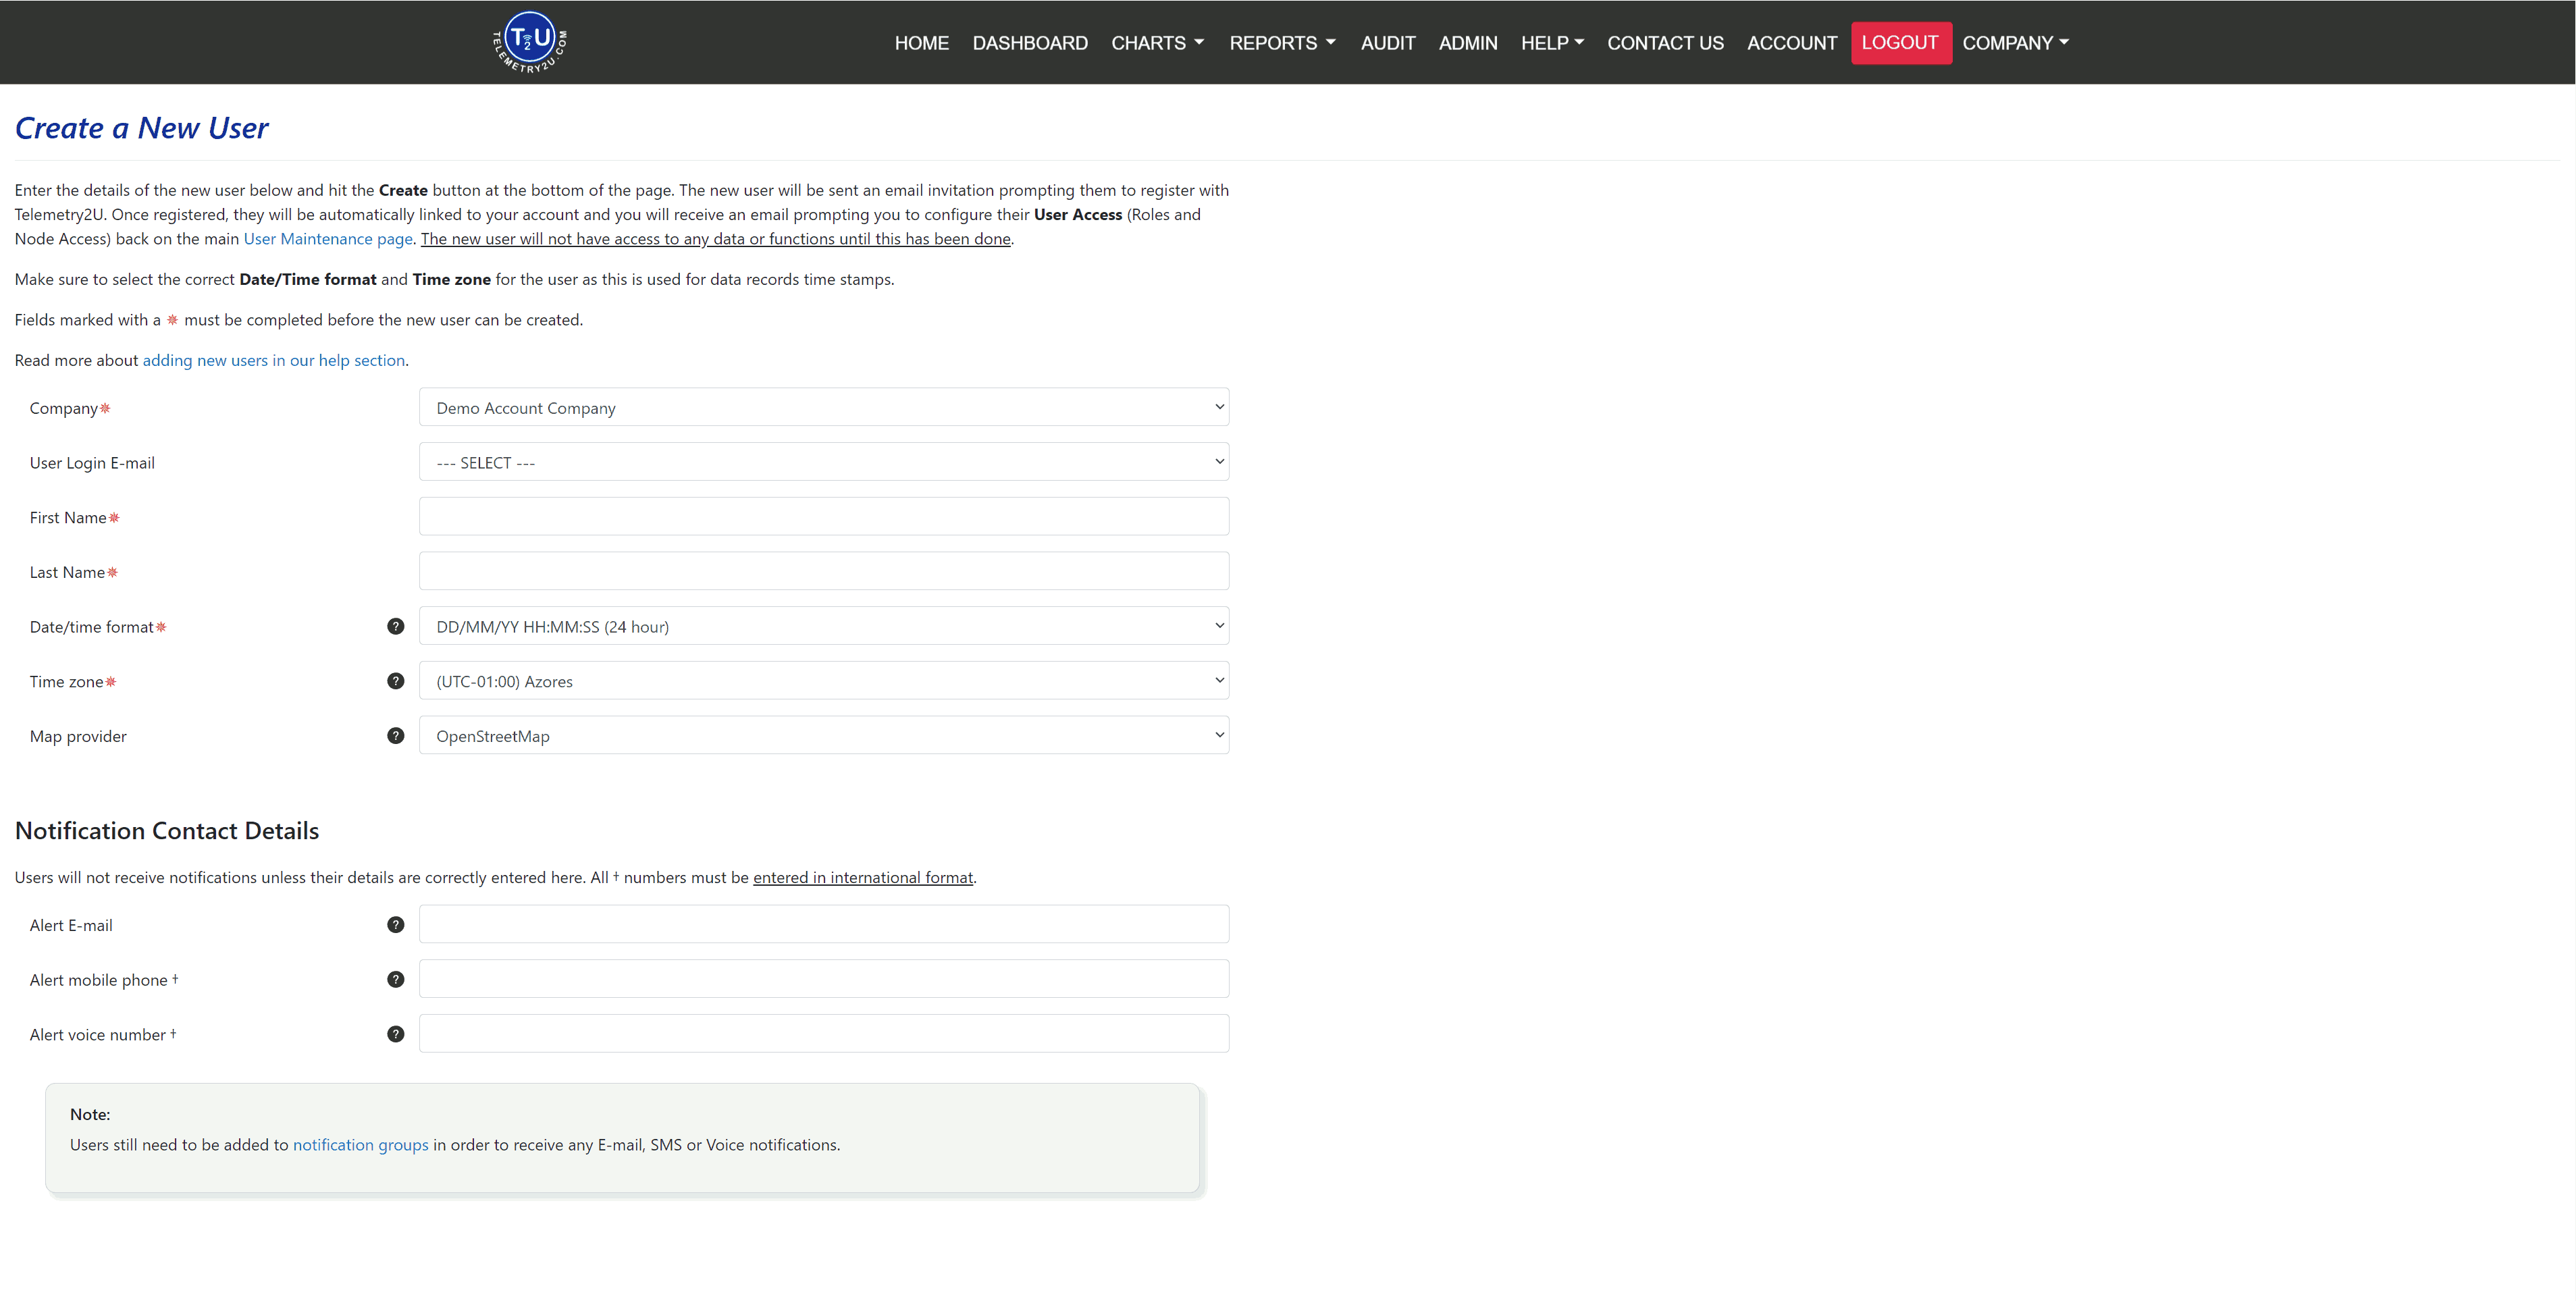
Invite users and set access
Add colleagues only when they need to view data, receive notifications, administer devices, or edit dashboards.
- Open User Maintenance and add the user. They will receive an email invitation to create or link their account.
- After registration, return to User Maintenance and configure User Access. A new user cannot see company data until access is assigned.
- Grant only the pages, nodes, administration functions, and dashboard editing permissions required for the user’s role.
- Users can update their own regional and notification contact details from the Account page.
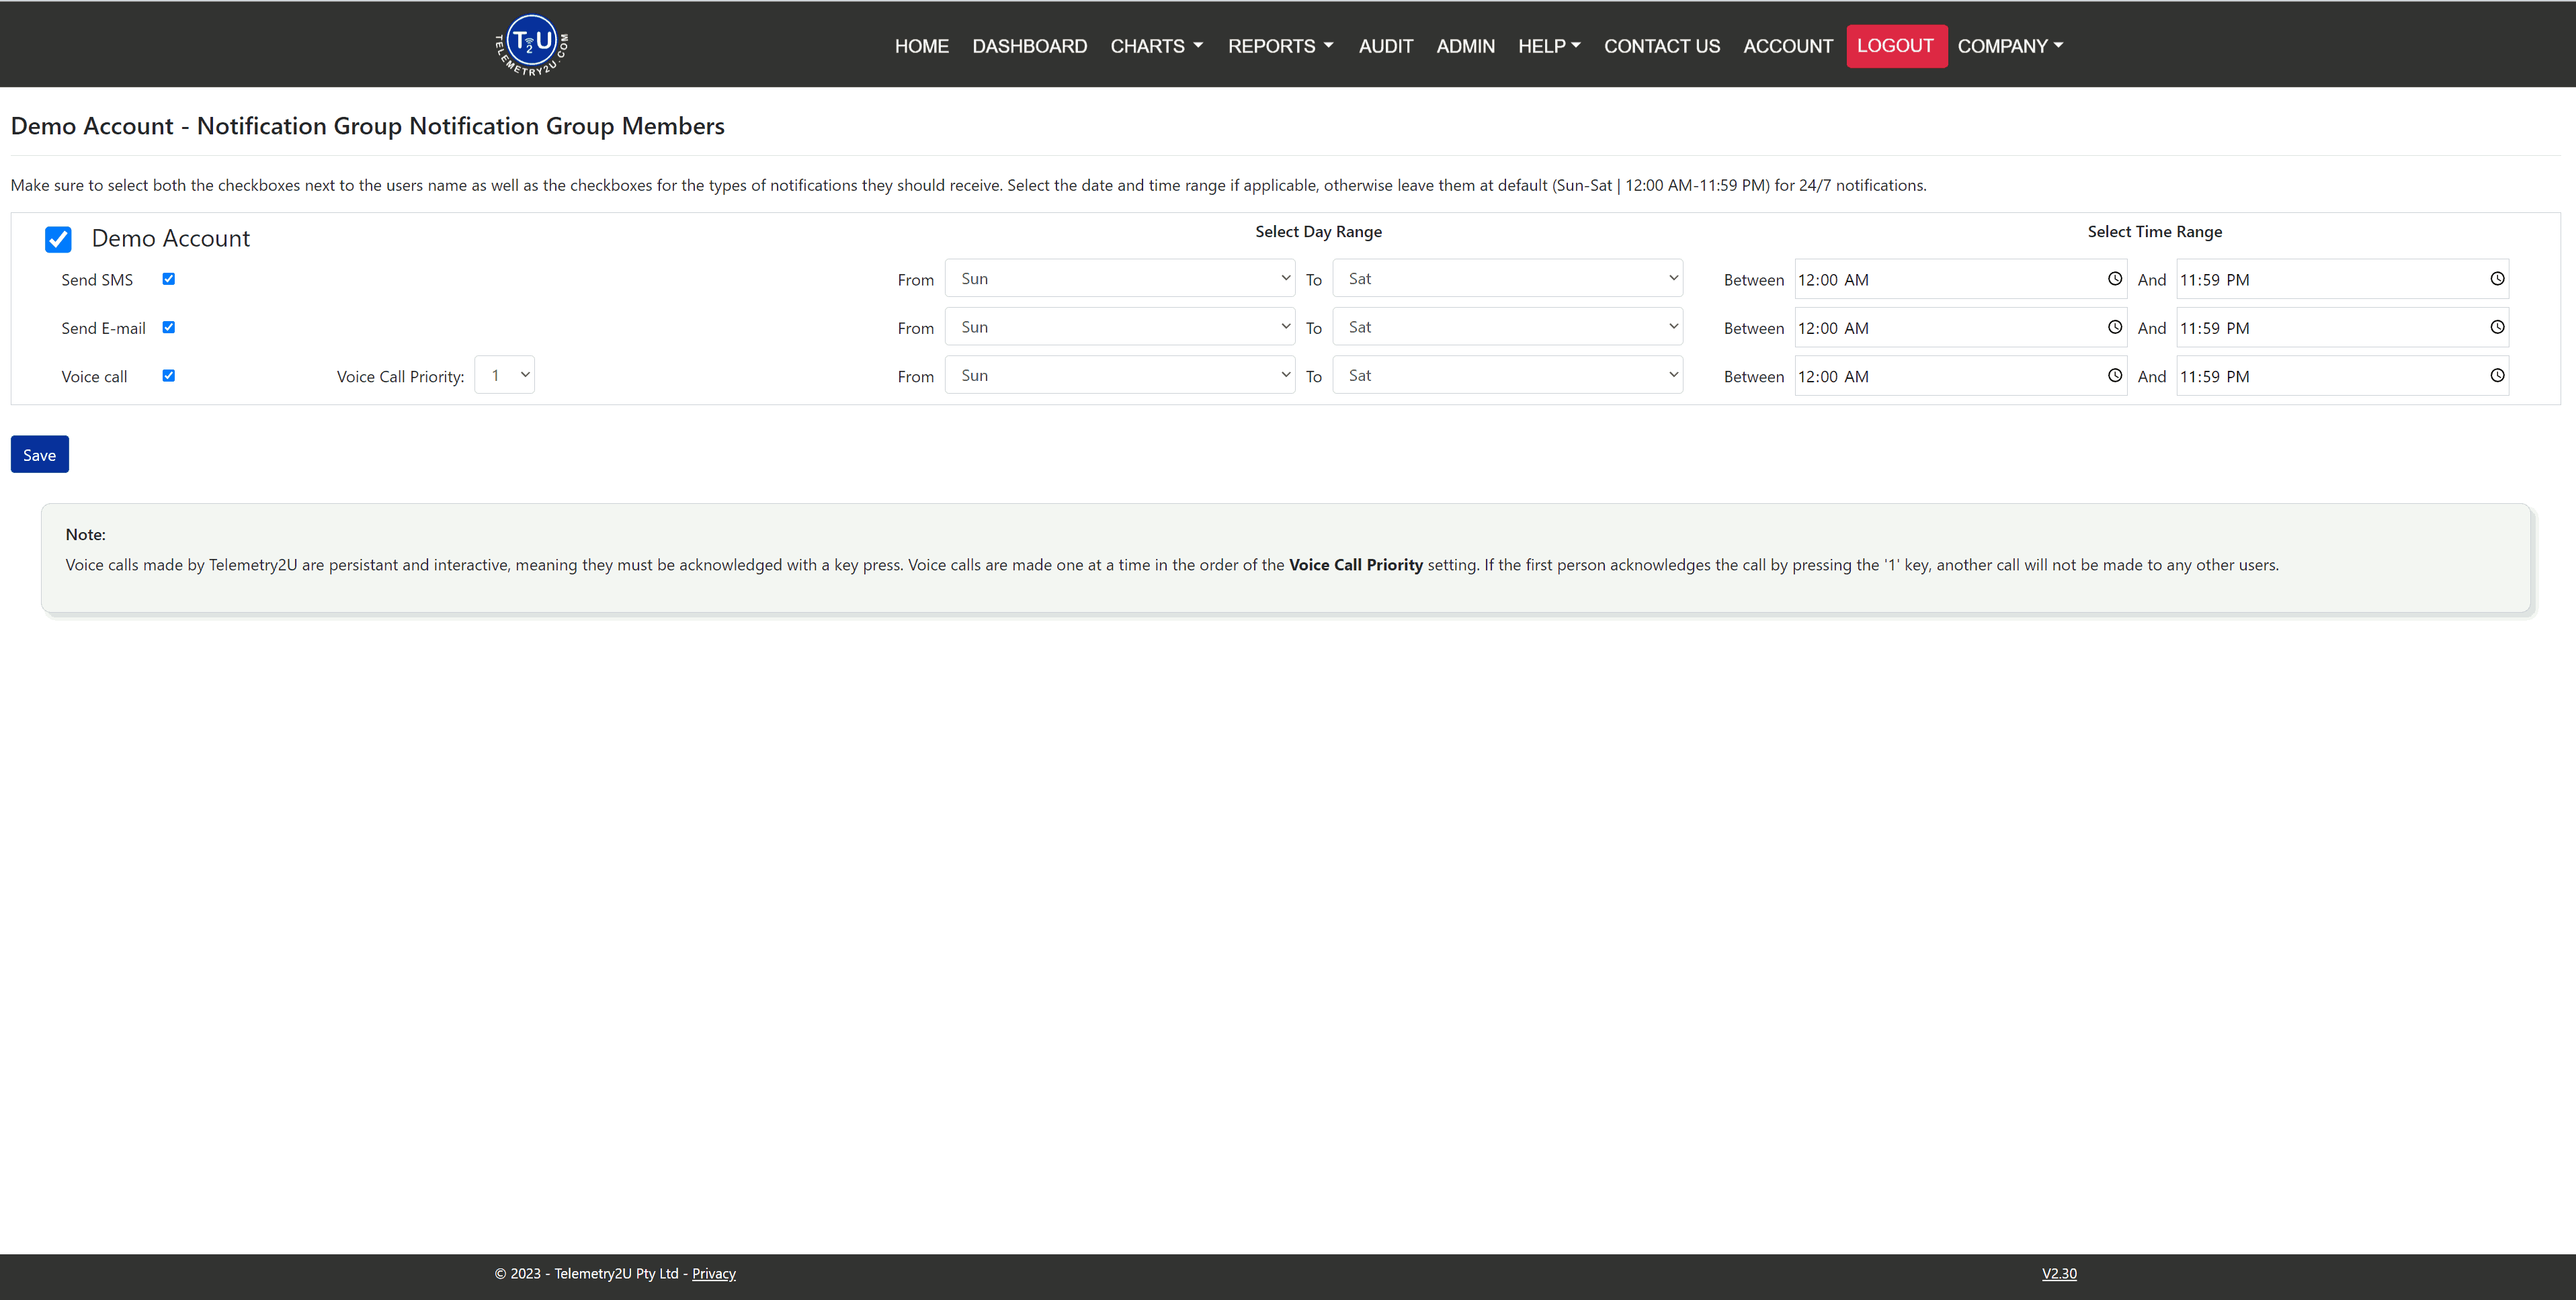
Create notification groups
Group users by responsibility, then choose which people receive email, SMS, or voice notifications and when they should receive them.
- Open Notification Group Maintenance and create a group for each team, roster, or escalation path.
- Open the group’s Members settings and select each user’s notification channels and active times.
- Use the group in alert conditions, or assign it to gateway and node loss-of-contact notifications.
- Create additional groups when daytime, after-hours, maintenance, or management notifications need different recipients.
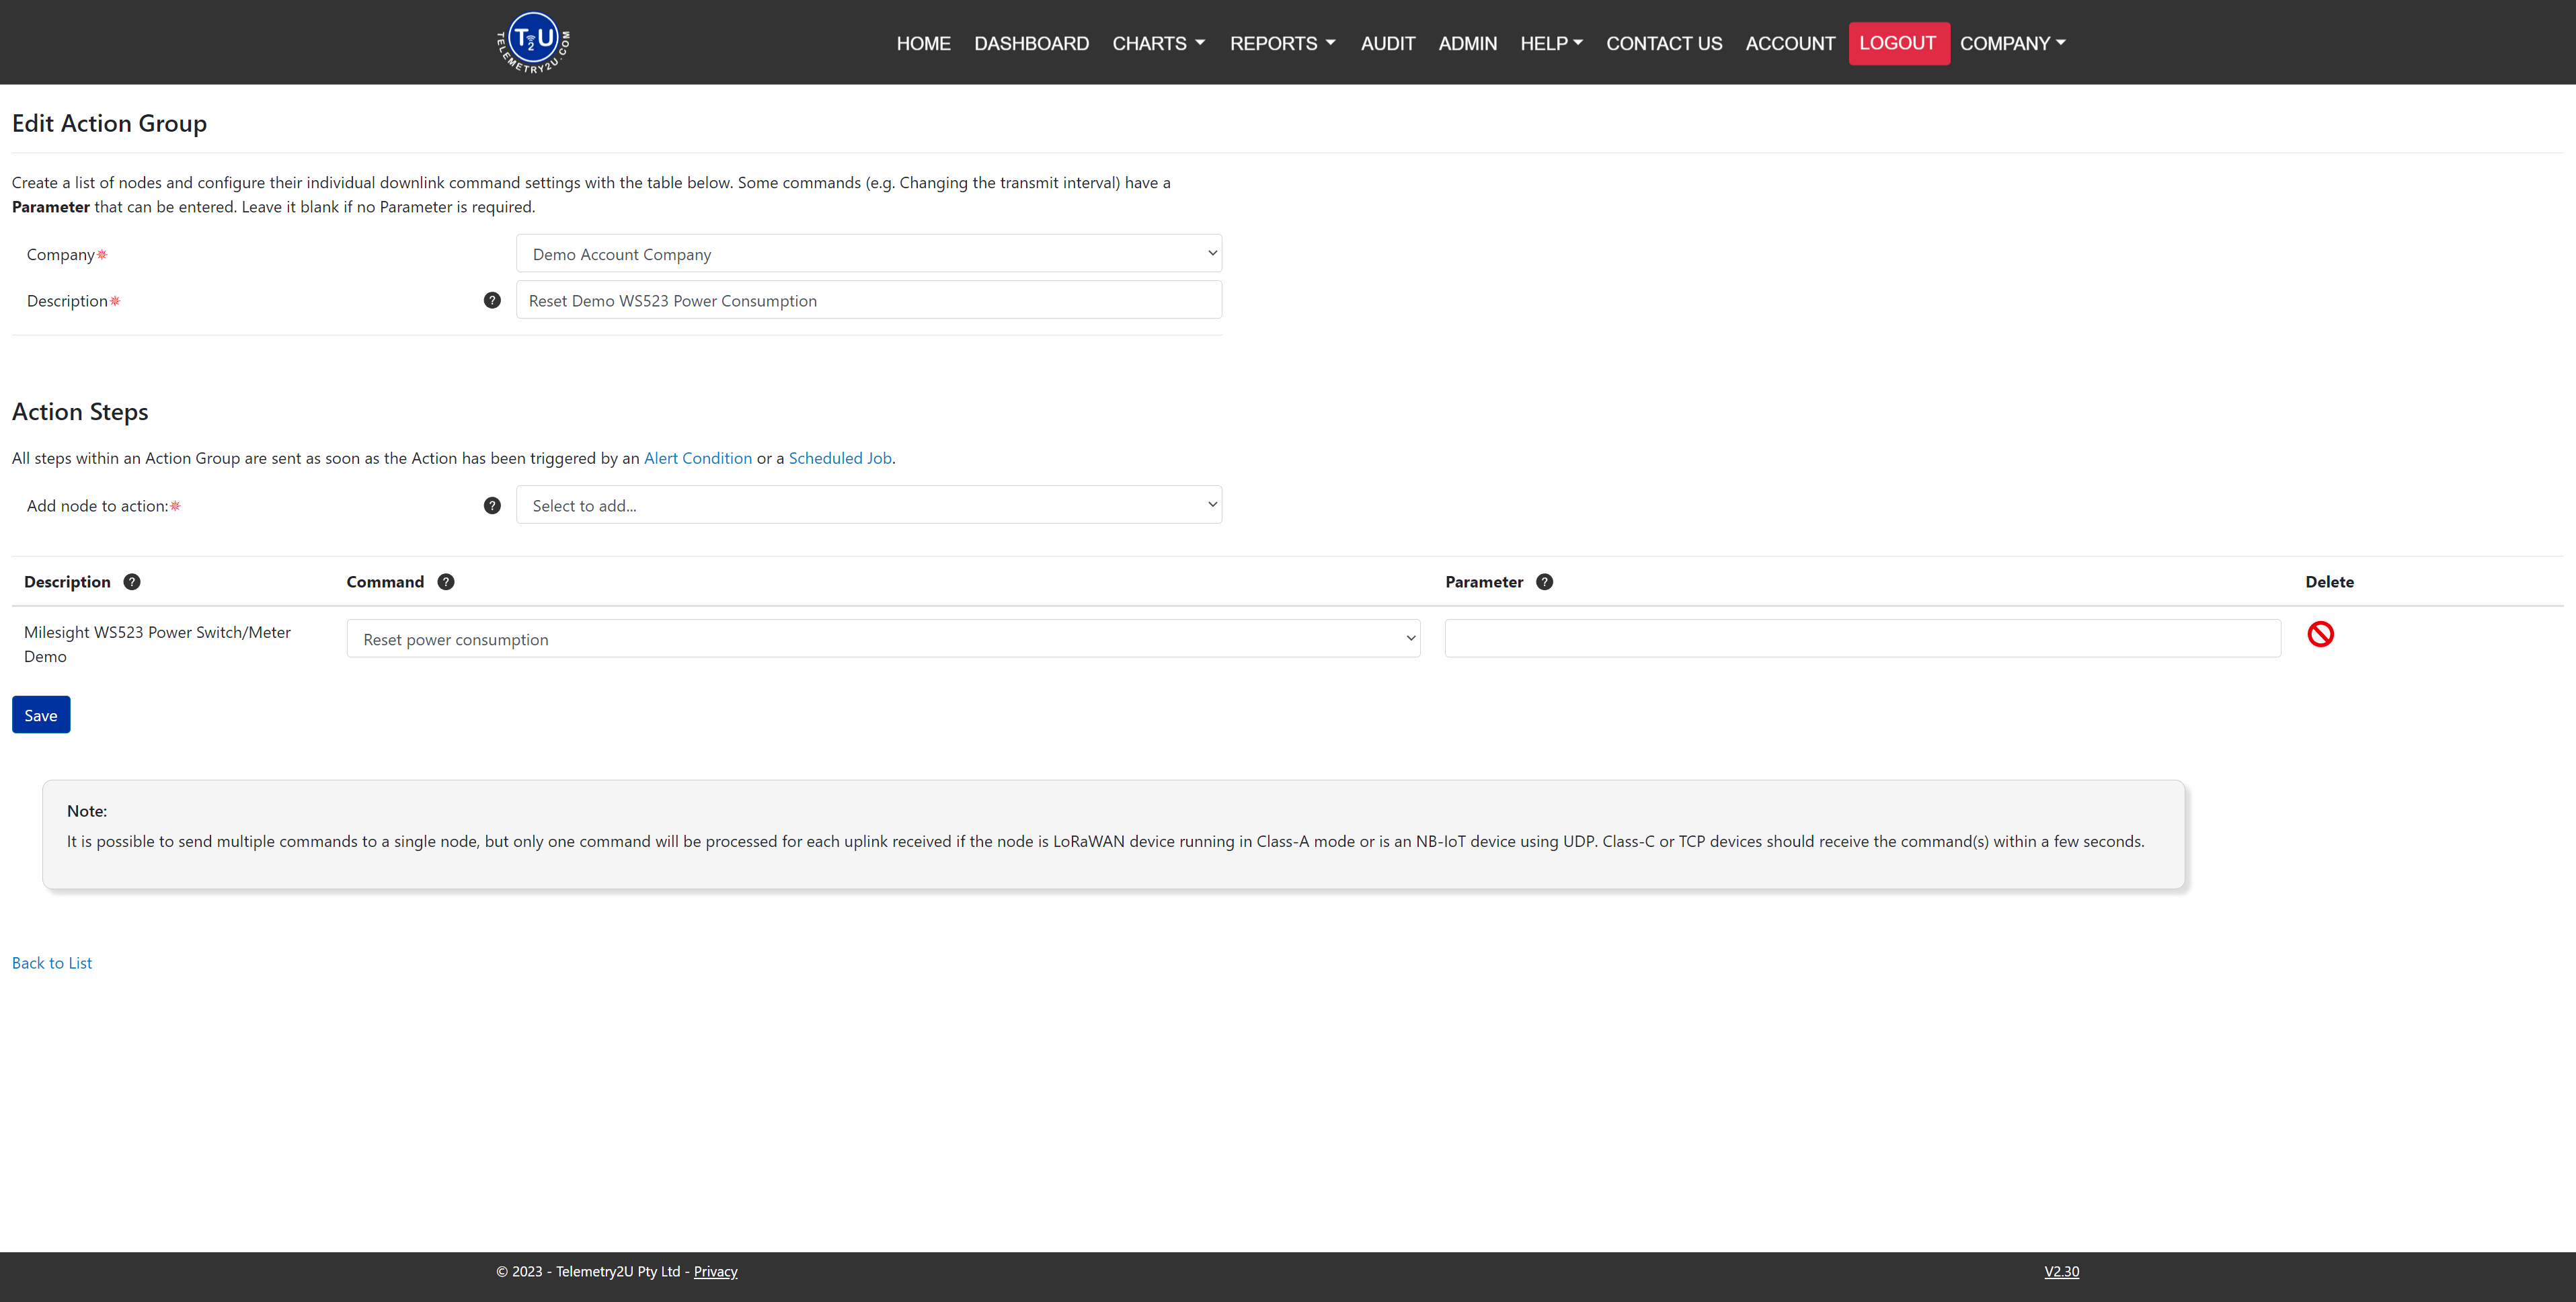
Create action groups
Send one or more device commands when an alert occurs, or run the same action automatically on a schedule.
- Open Action Maintenance and create an action group.
- Add each downlink command in the order it should be sent. A group can contain a single command or a sequence across multiple devices.
- Attach the action group to an alert condition when a sensor event should trigger it.
- To run the action at a set date or time instead, create a job in Scheduled Actions.
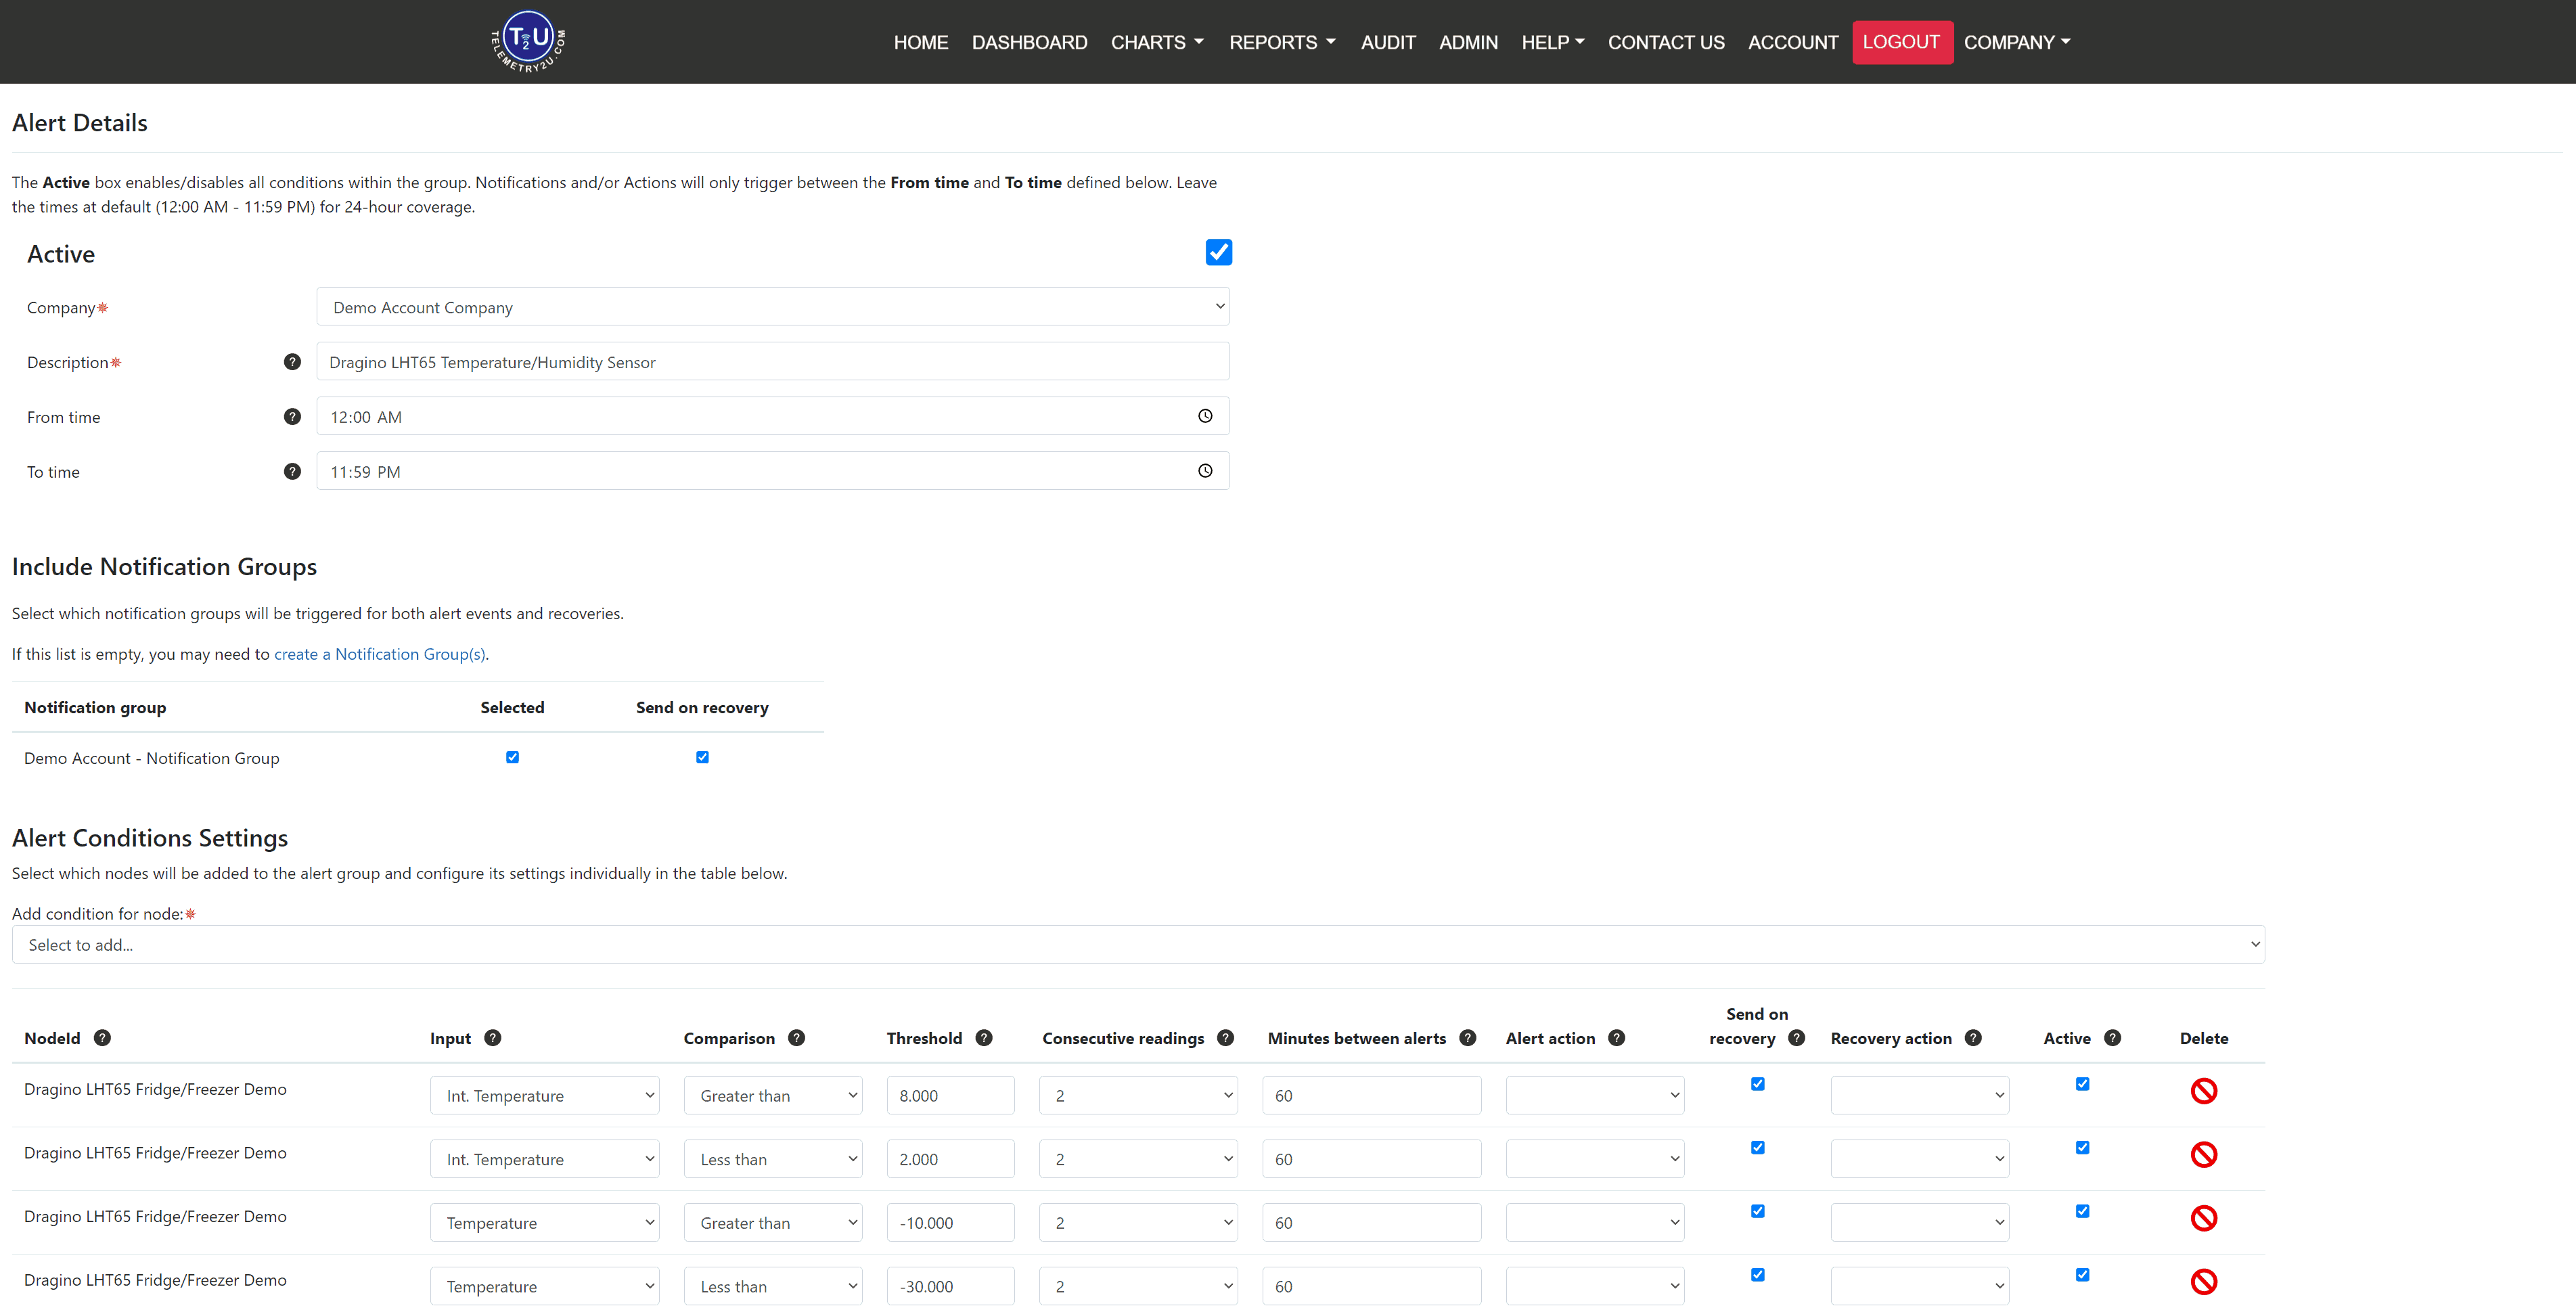
Create alert groups
Define the conditions that matter, choose who is notified, and optionally trigger an automated action when a reading moves outside its expected range.
- Open Alert Maintenance and create an alert group.
- Add a node and select the sensor input and condition to monitor. Add the same multi-sensor node more than once when different inputs need different conditions.
- Select the notification groups and action groups to trigger when the condition is met. Recovery notifications can also be sent when the reading returns to normal.
- Set the active days and times when the alert should operate, then save and test the workflow.
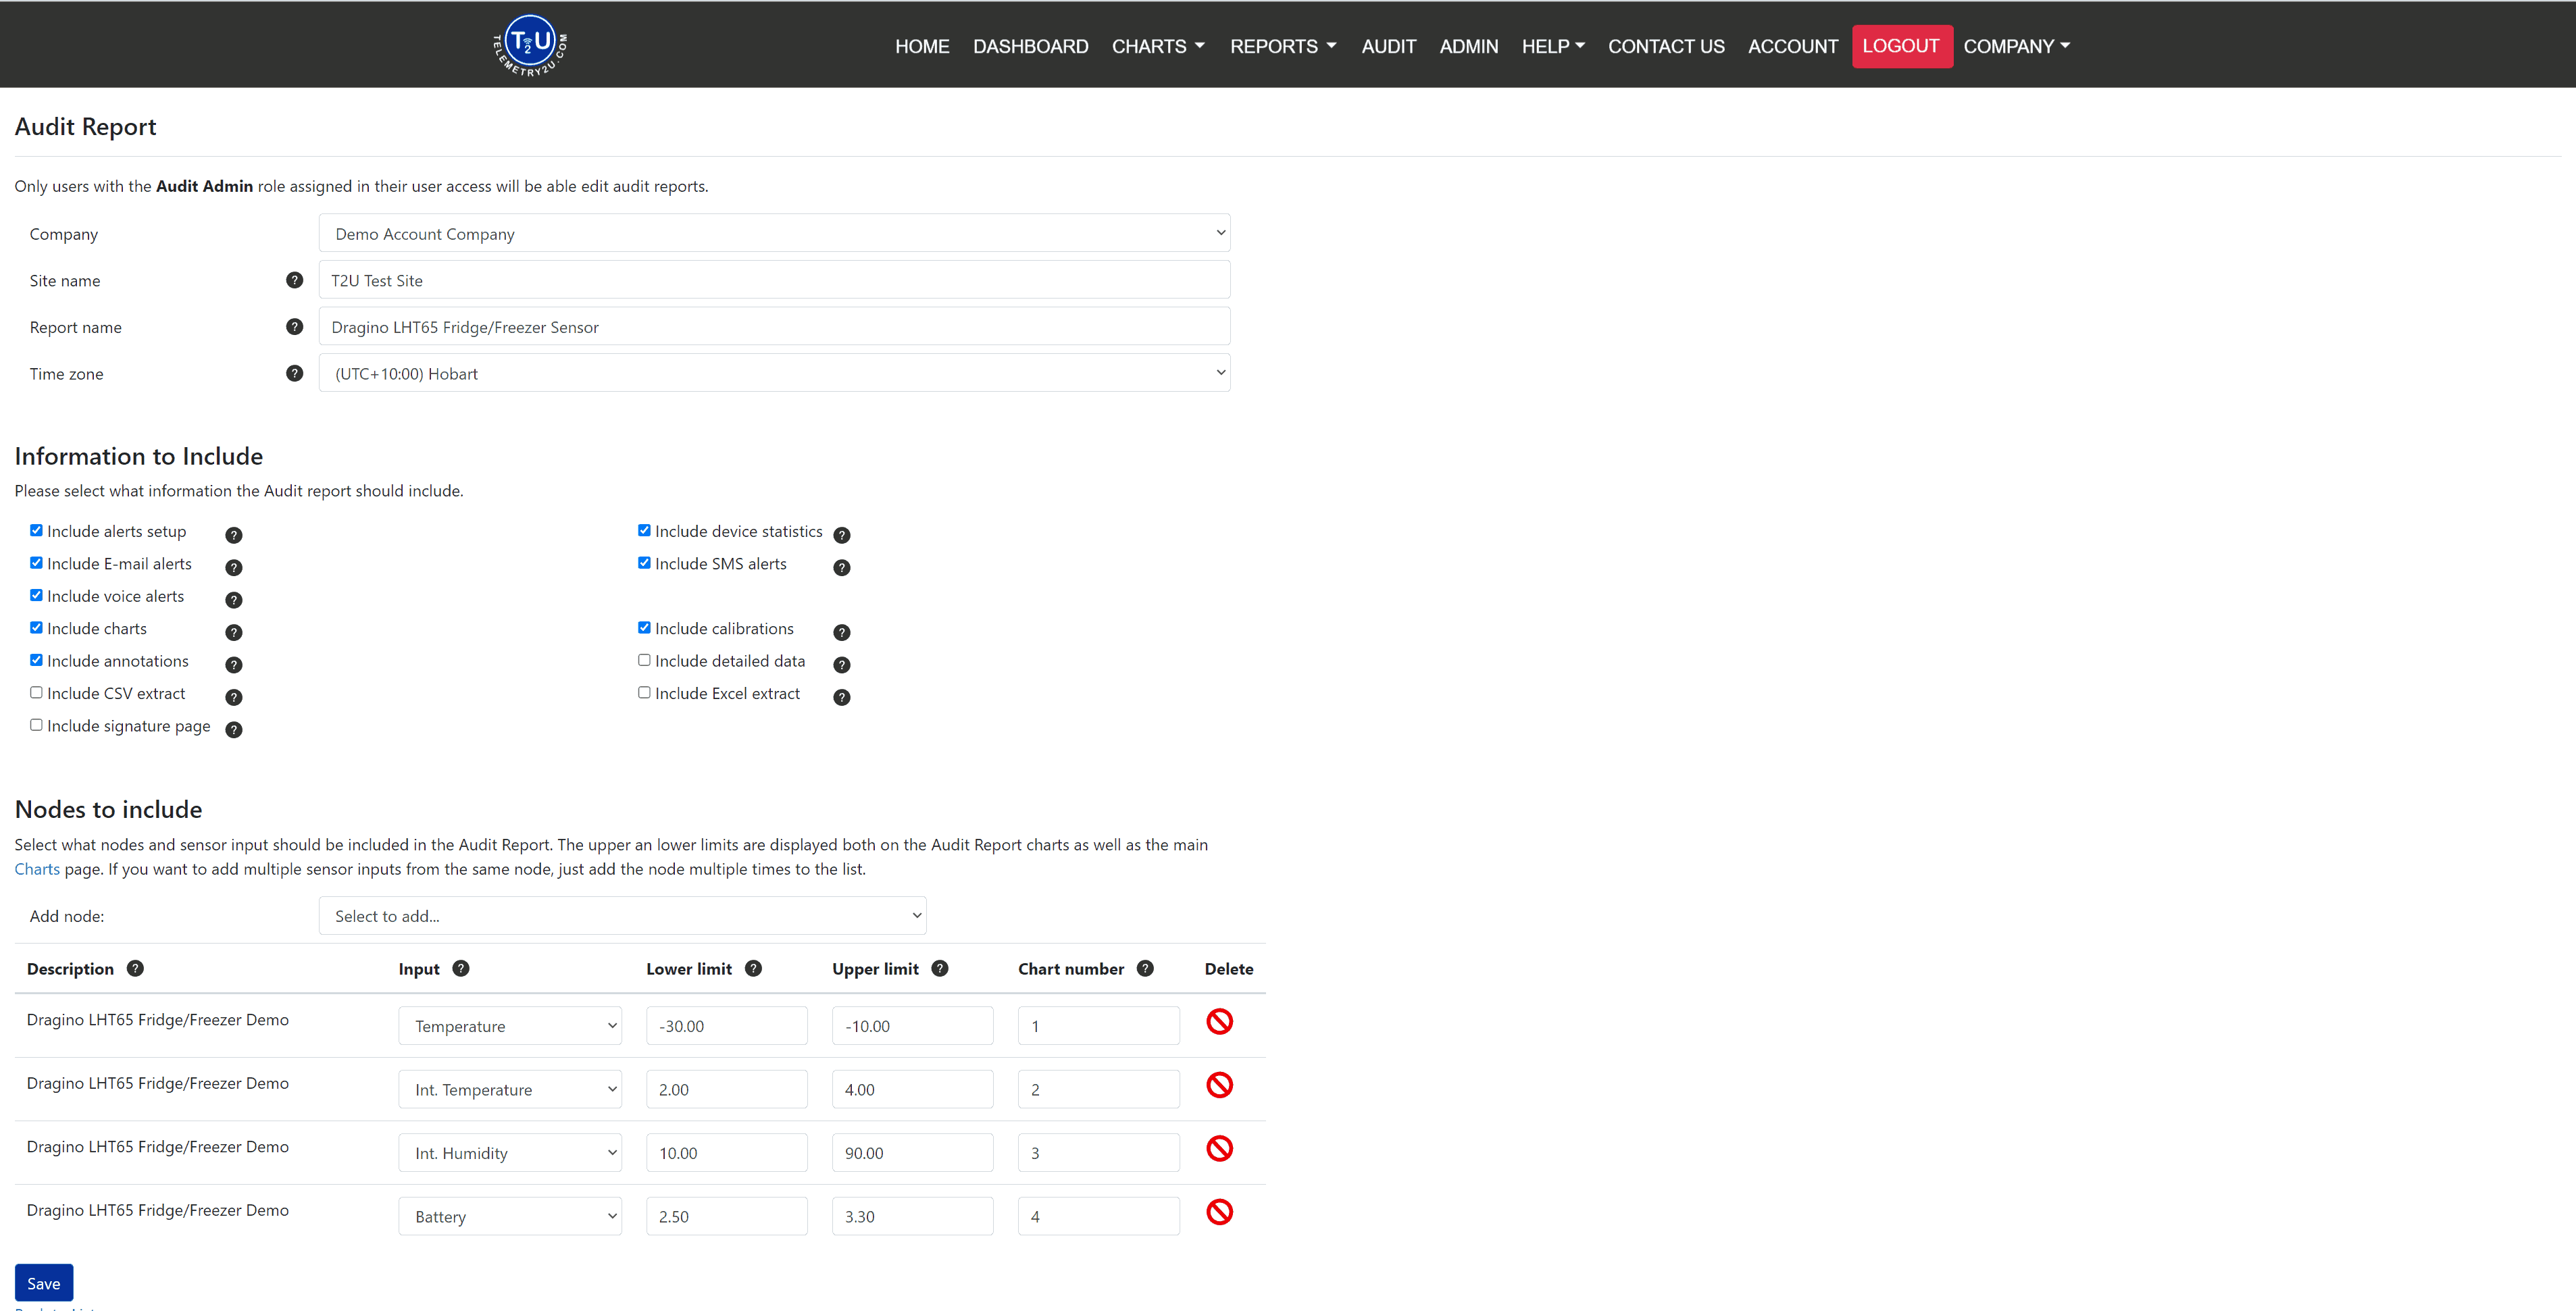
Create audit reports
Build reusable PDF report definitions for selected sensors, limits, annotations, alert events, and scheduled distribution.
- Open Audit Report Maintenance and create a report definition.
- Add the required nodes and sensor inputs, then enter high and low limits where applicable. These limits are displayed on report and chart visualisations.
- Users with access to every included node can generate the PDF from the Audit page for the required date range.
- To email reports automatically, add a job in Scheduled Jobs and select the report and recipients.
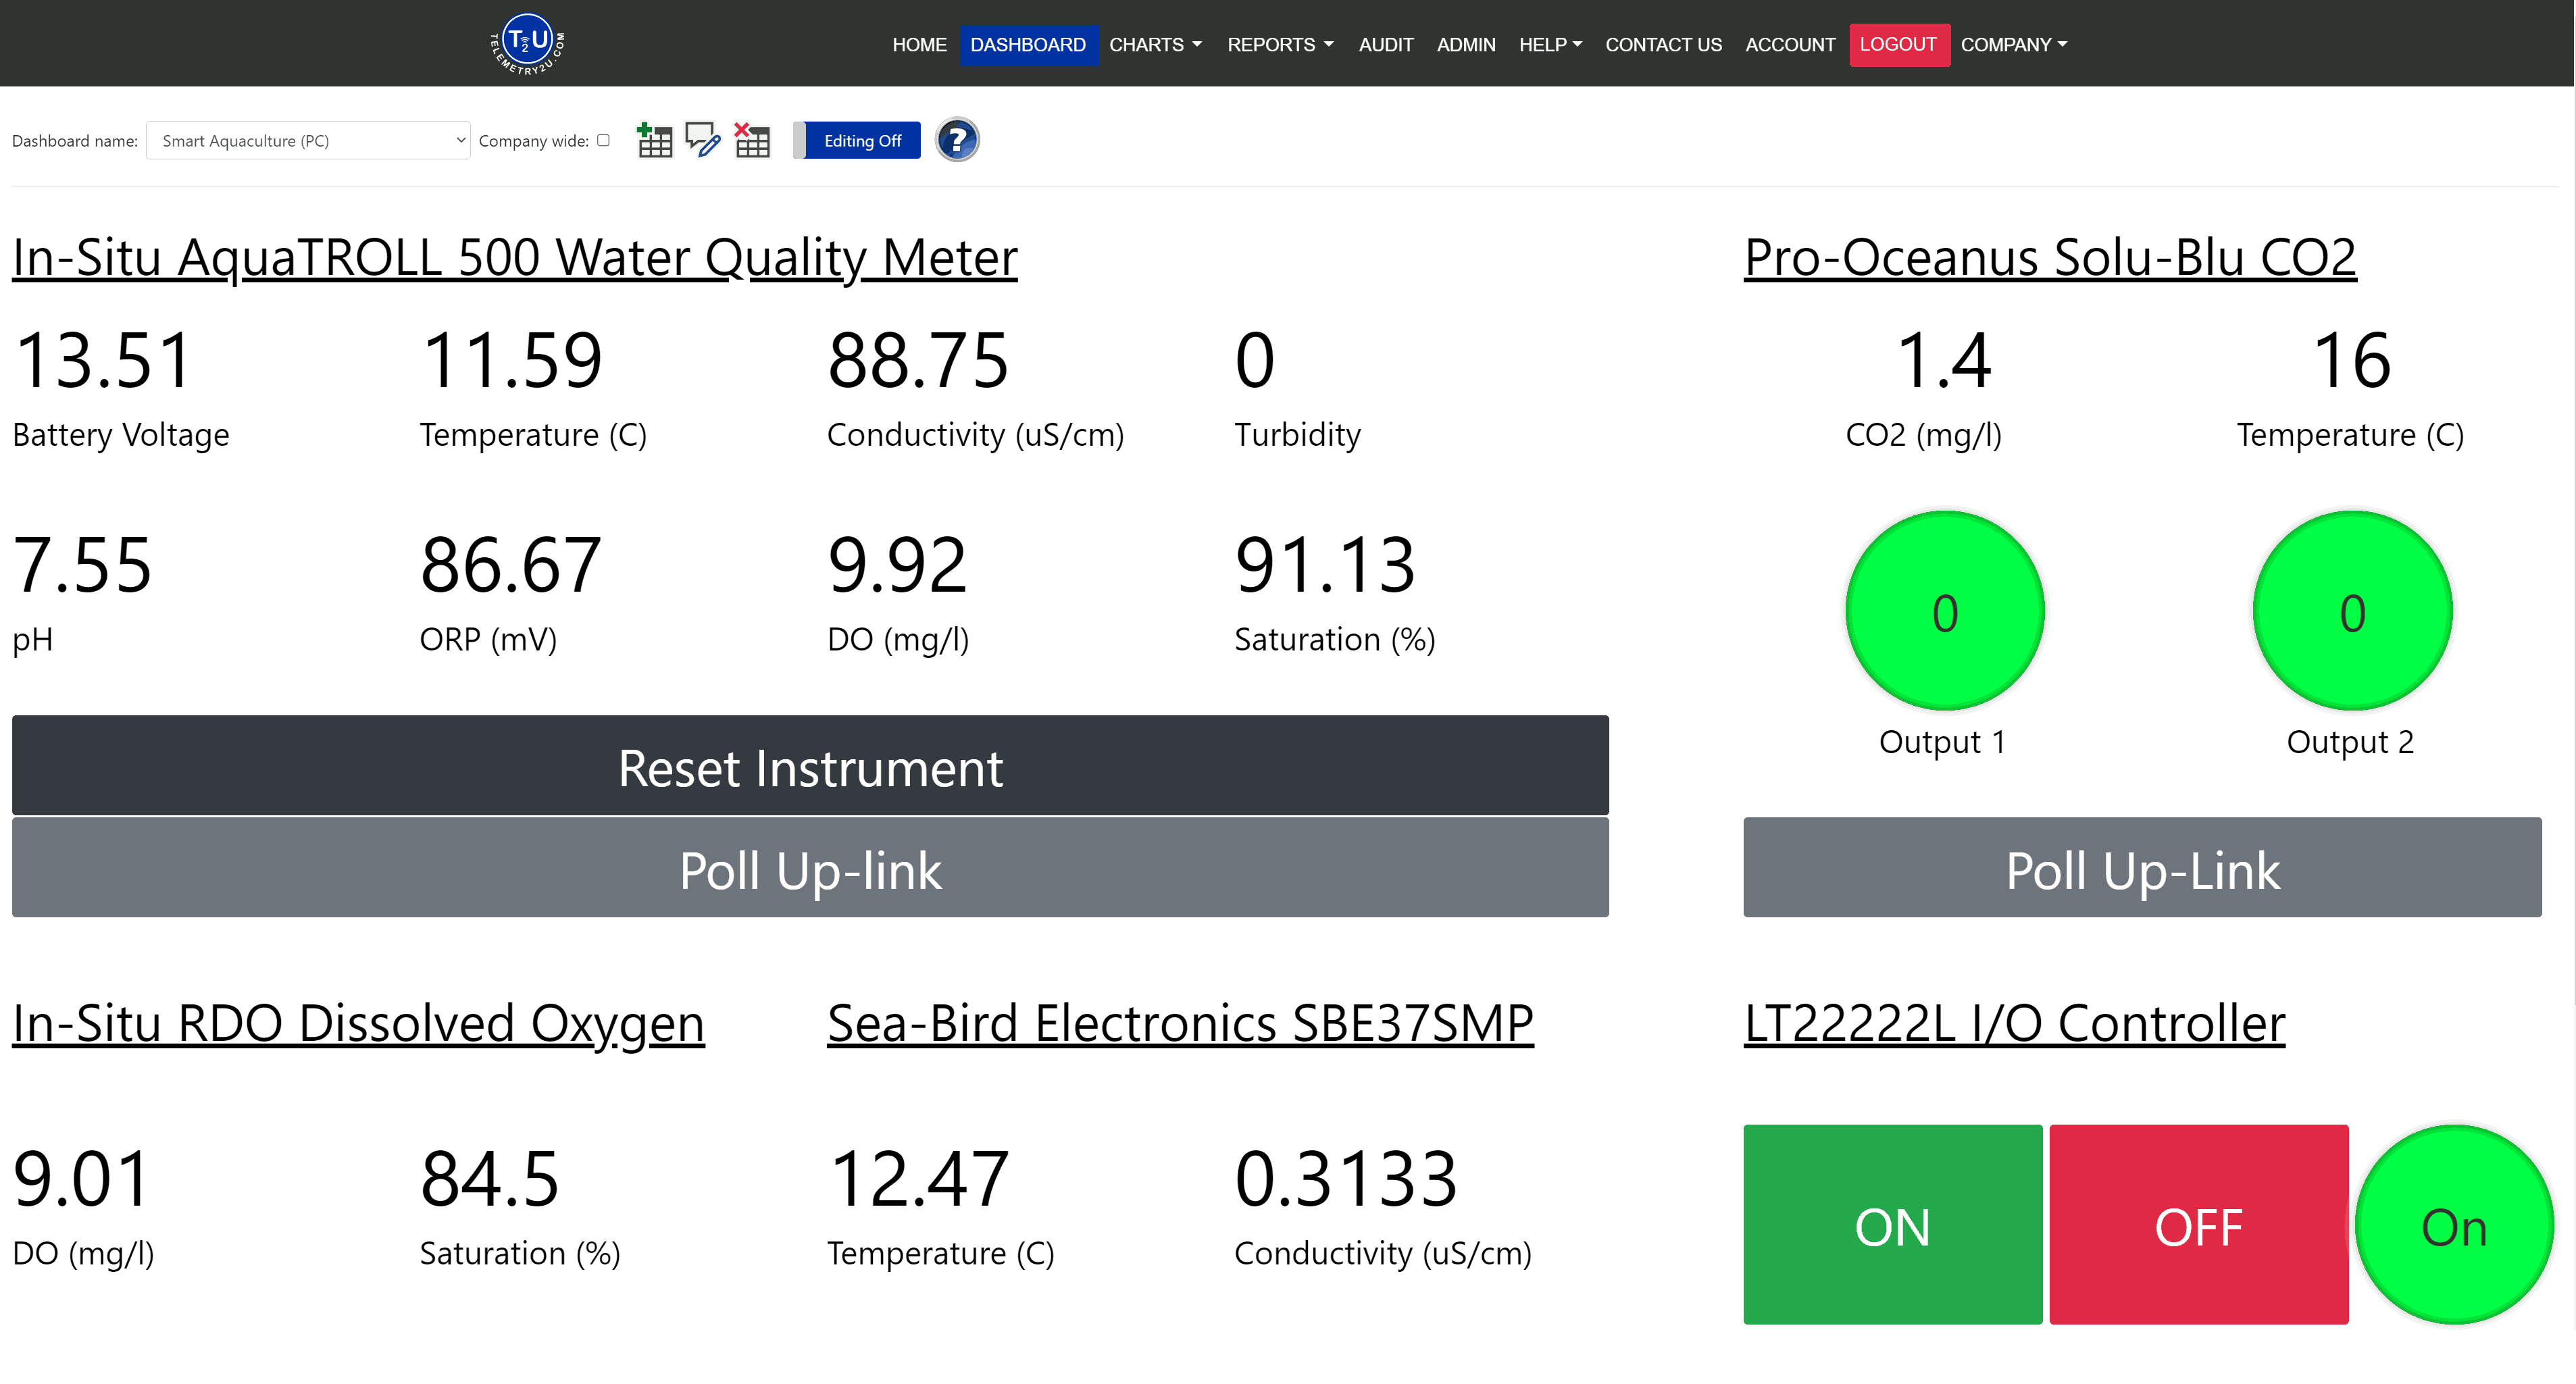
Build and share dashboards
Turn live sensor data into focused views for operators, managers, displays, or customers without changing the underlying device configuration.
- Open the Dashboard page and select Create Dashboard.
- On a PC or laptop, enable Editing On to display the widget menu. Add a widget, then double-click it to select a sensor and configure its display.
- Drag and resize widgets to arrange the layout. Move a widget over the Delete control to remove it.
- Select Company Wide to make the dashboard viewable by all users under the account, or use Copy Dashboard to assign a copy to a specific user.
Continue with the detailed documentation
The quick guide covers the normal setup path. Use the detailed help pages when you need every setting, permission, status, report option, or troubleshooting note.