6.1 - Main Admin Page
After signing in, use the collapsed navigation rail or expanded sidebar to open visualisation, administration, account, and help pages available to your user account.
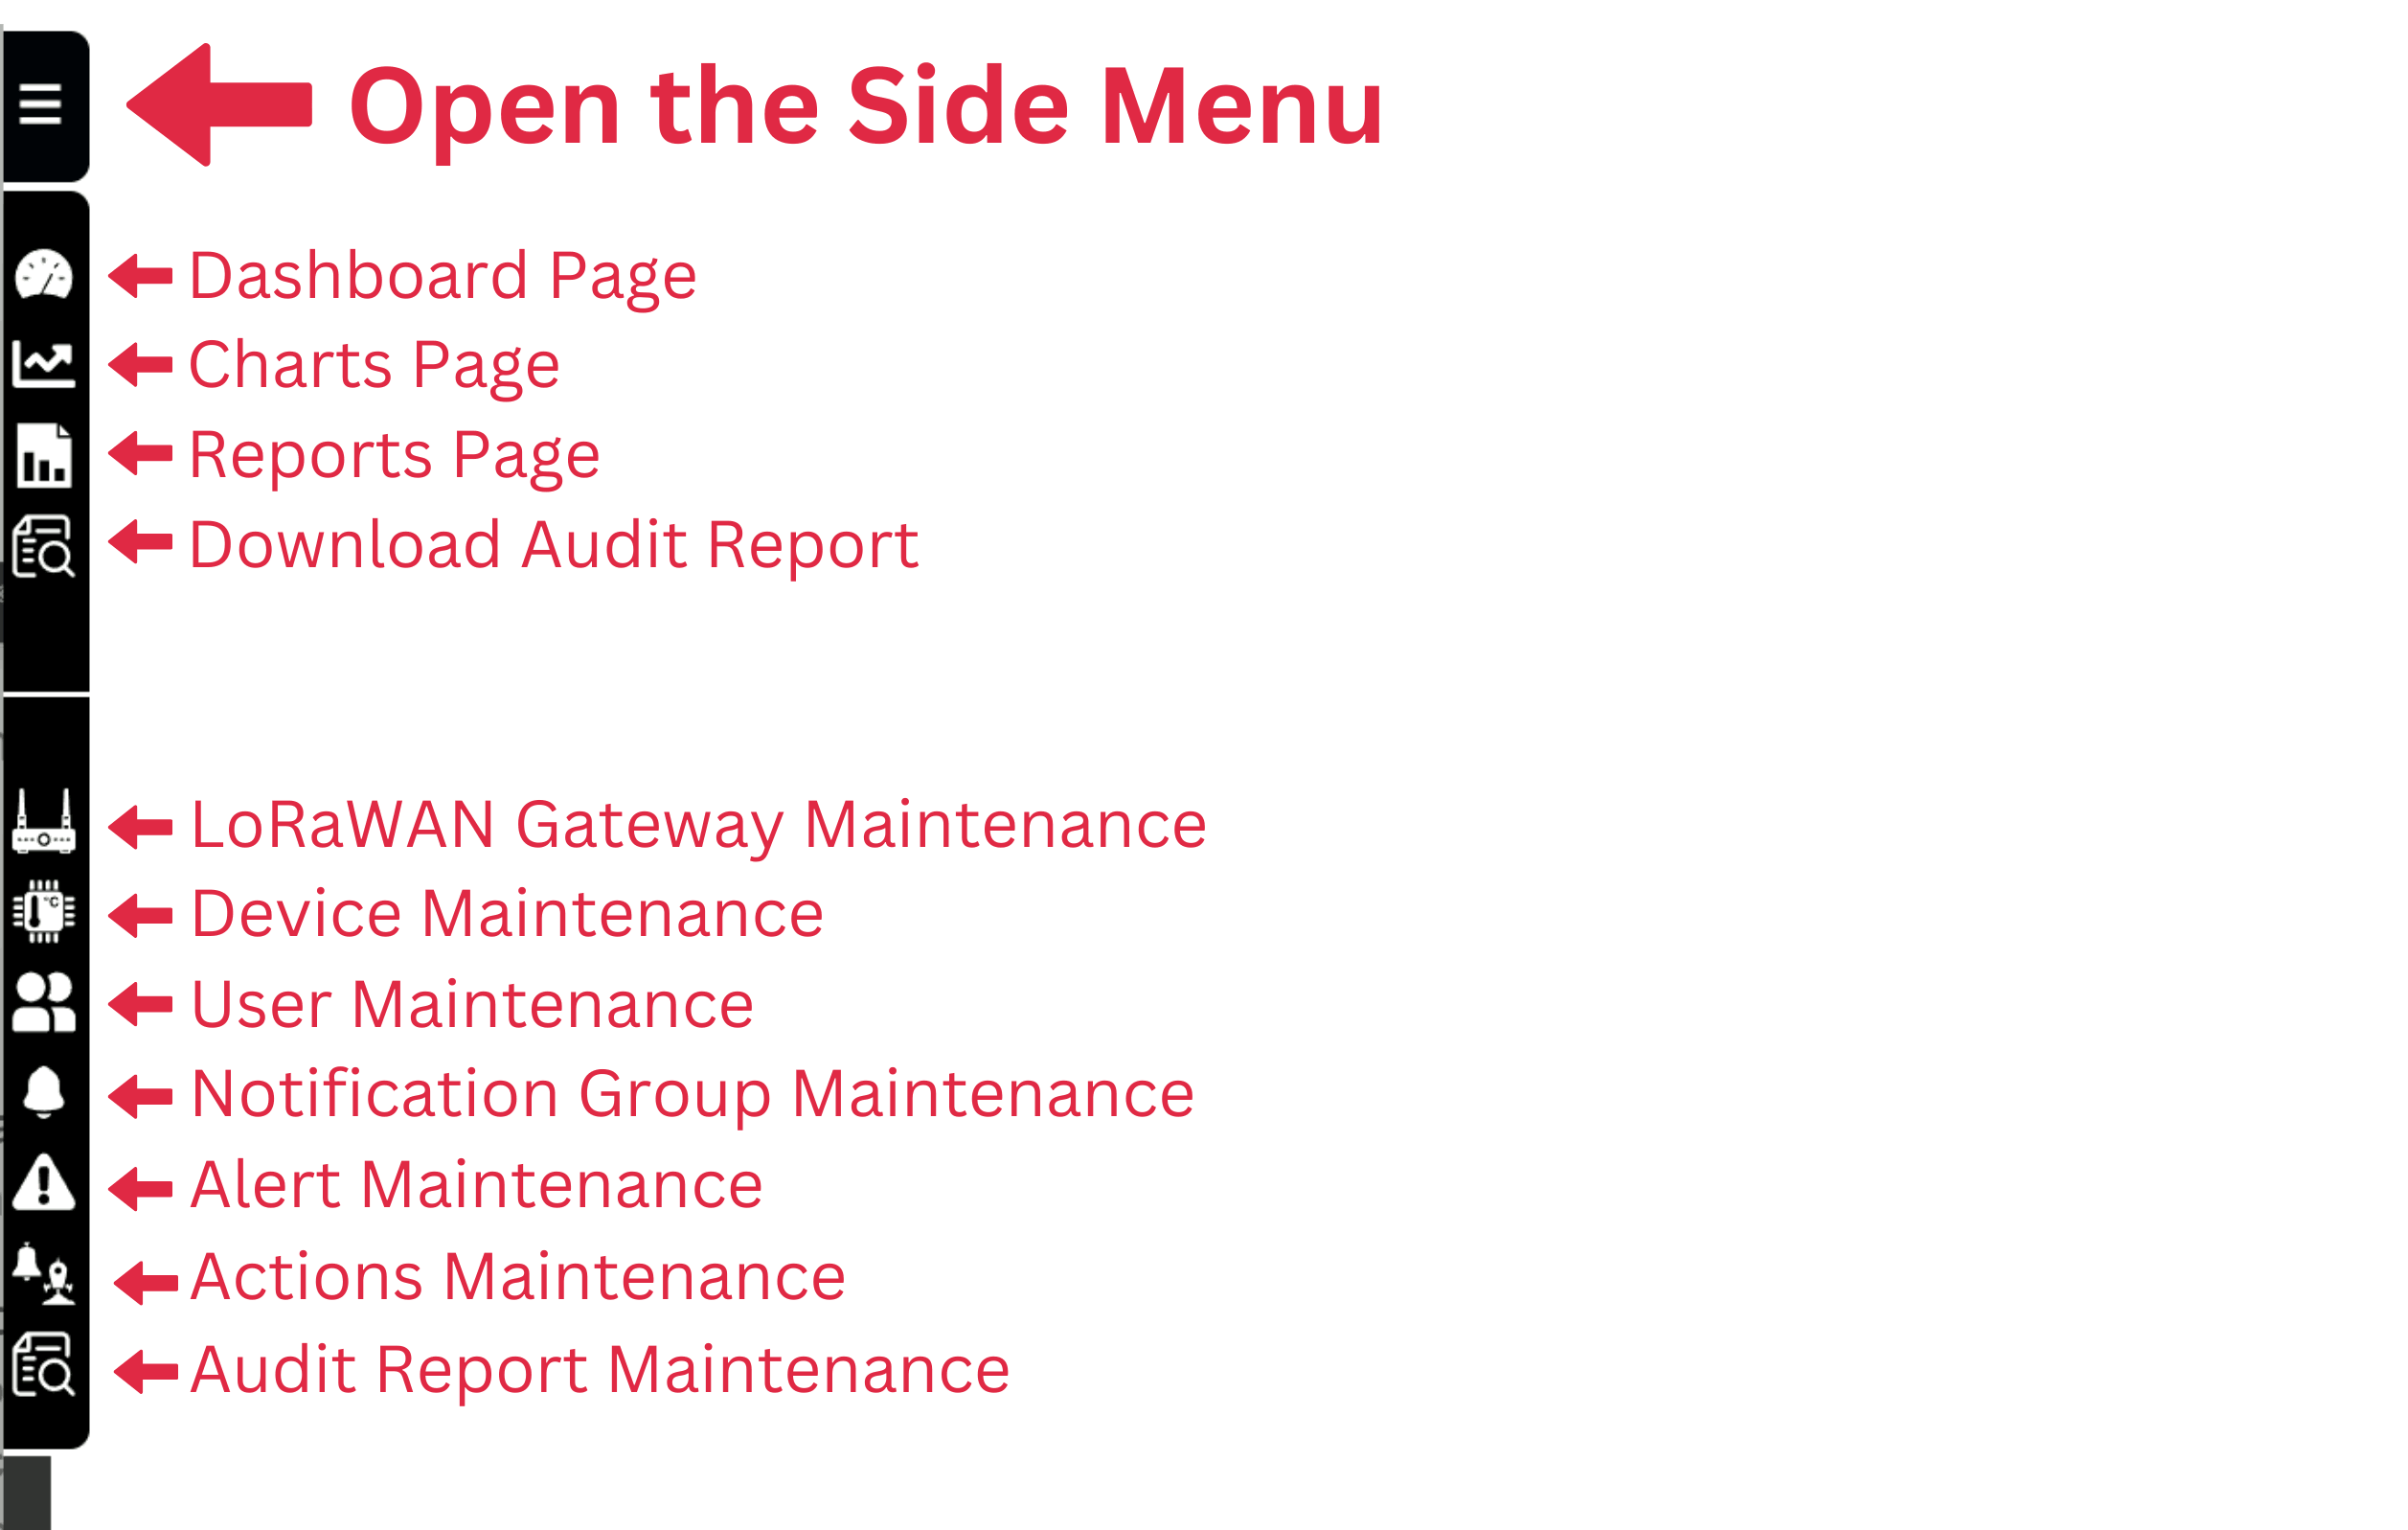
Select the menu button at the top of the navigation rail to expand the full sidebar. The shortcuts and administration options shown depend on the roles and node access assigned to your account. Hover over a collapsed navigation icon to view its label.
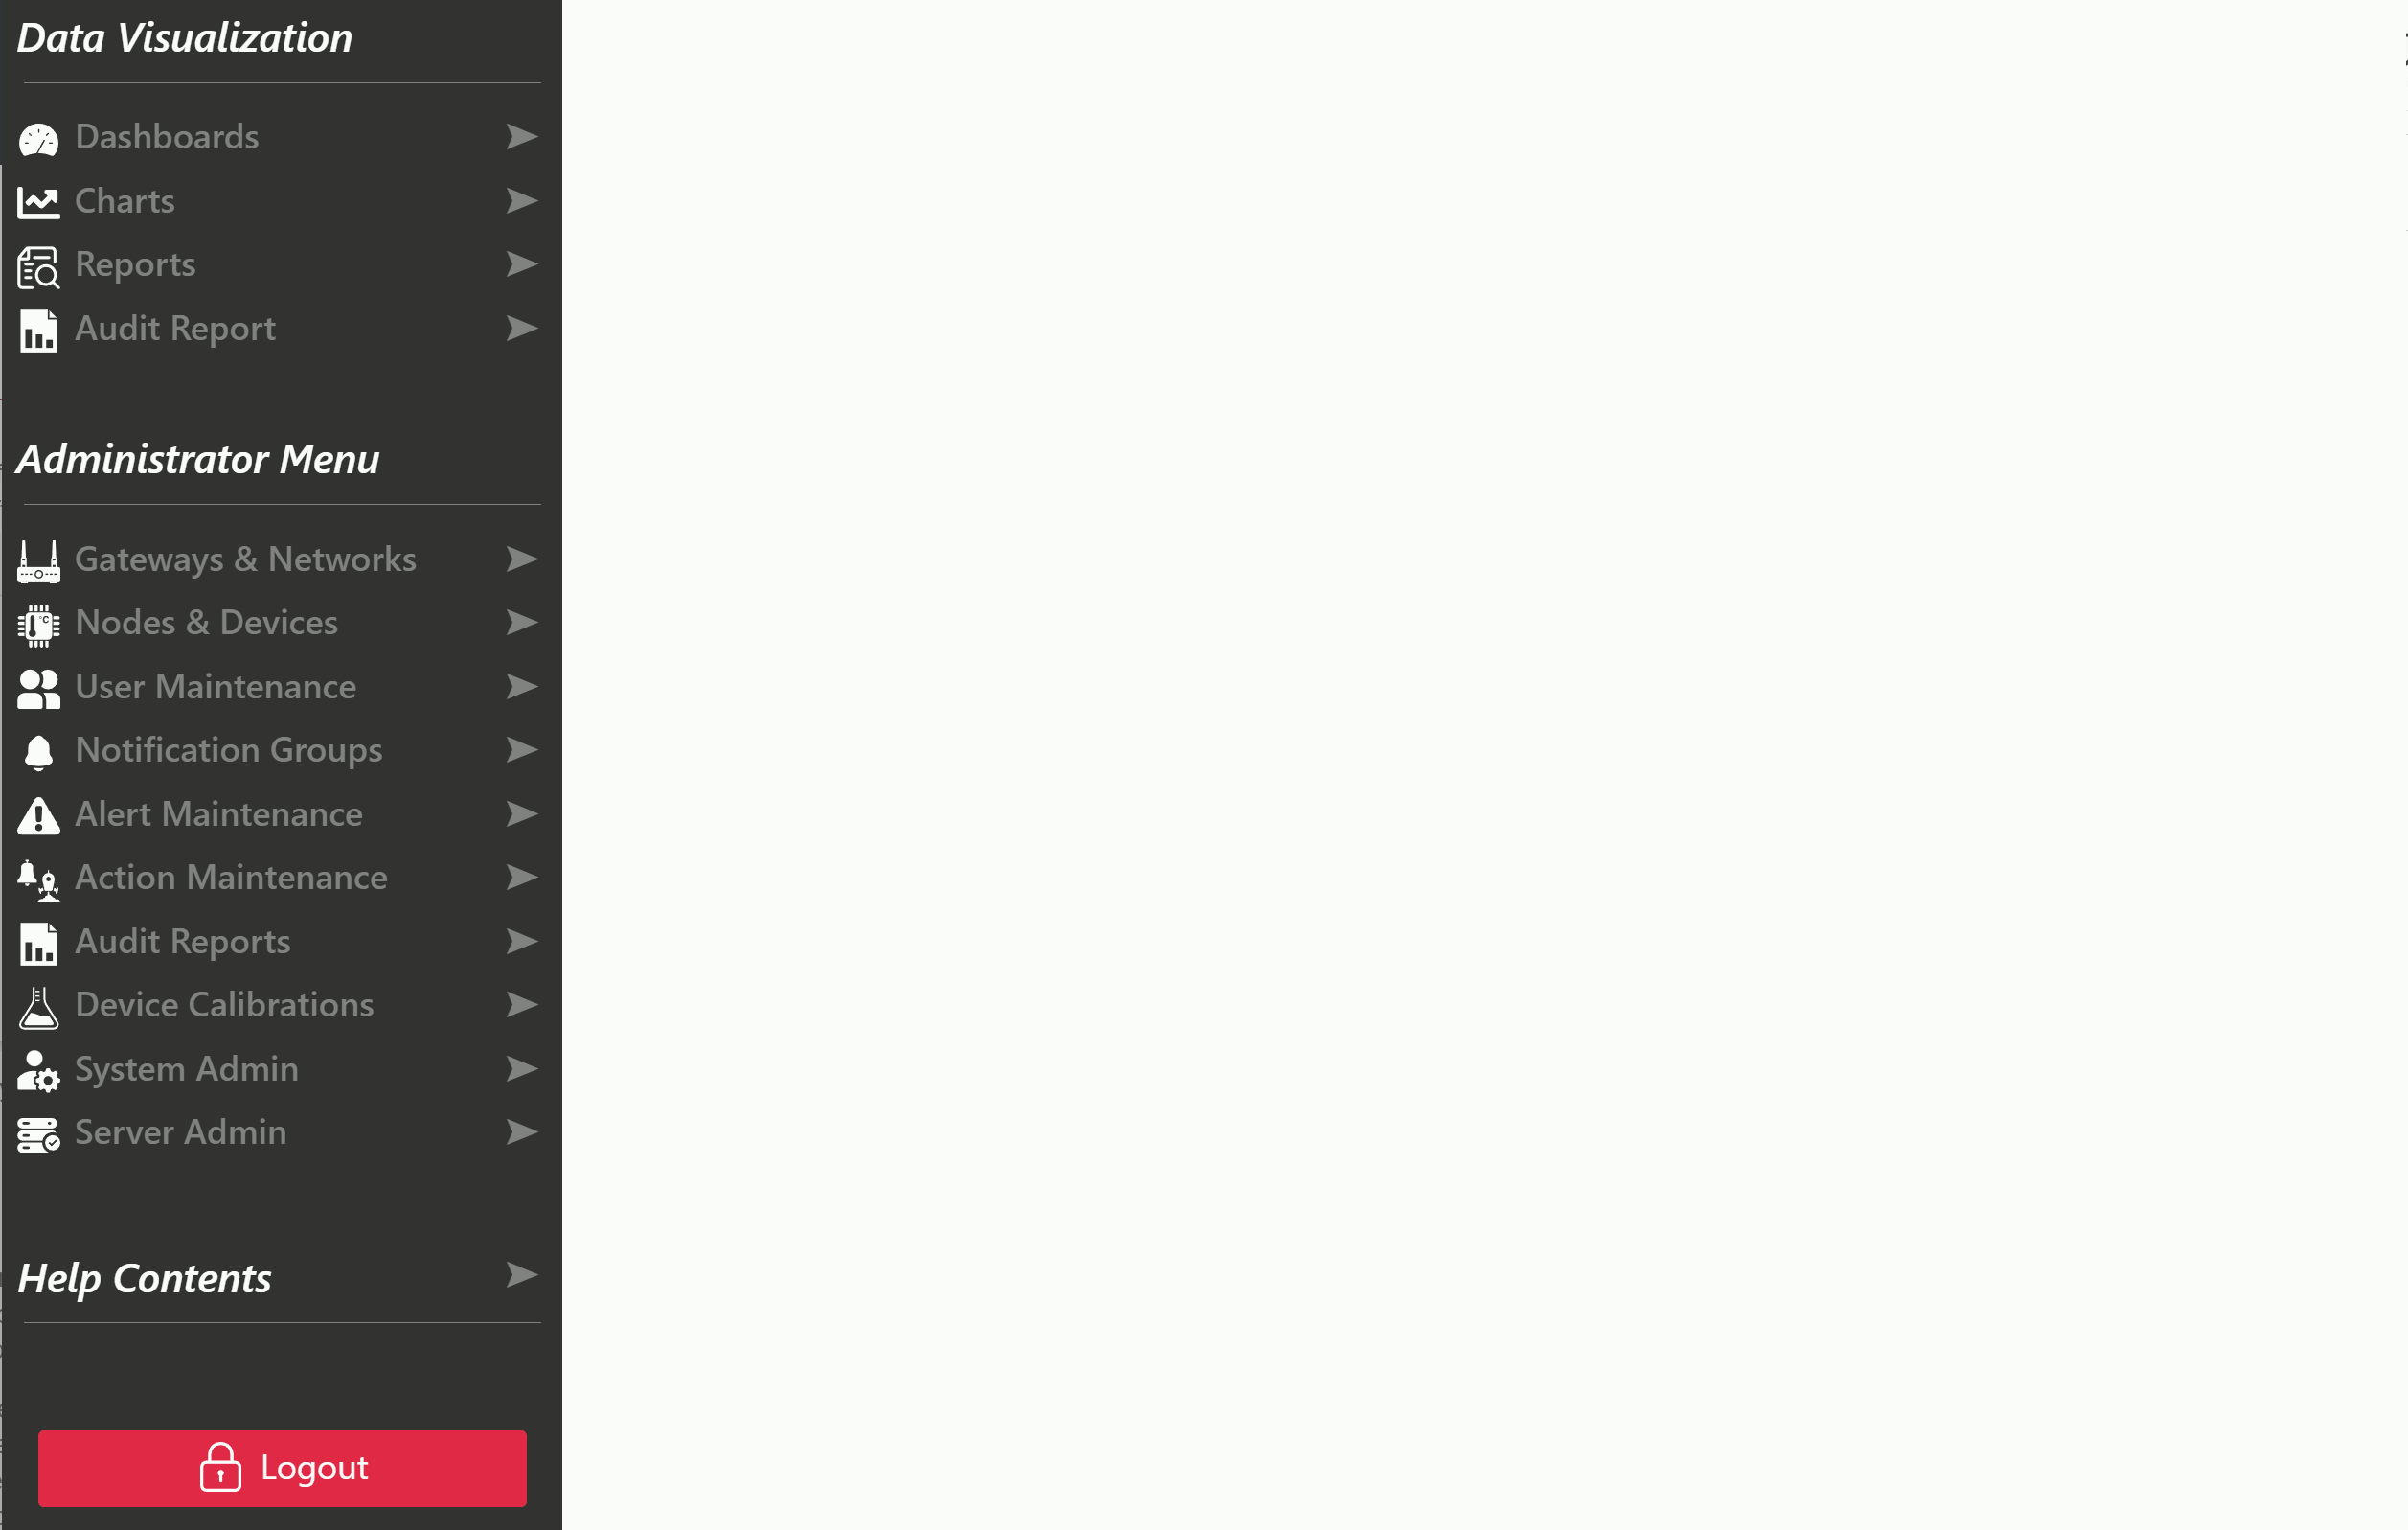
Data Visualisation
Open dashboards, charts, reports, and audit reports to review current and historical sensor information available to your account.
Administrator Menu
Manage users, notifications, alerts, nodes, gateways, calibrations, actions, integrations, and system notices according to your assigned roles.
Help Contents
Open the shared help menu from any documentation page and select a numbered topic to move directly to the relevant section.
Administration Page Conventions
Required Field
A red required-field marker identifies information that must be entered before a form can be saved.
Tooltip
Hover over or focus the tooltip icon to view additional guidance about the associated field. Essential instructions are also provided as page text.
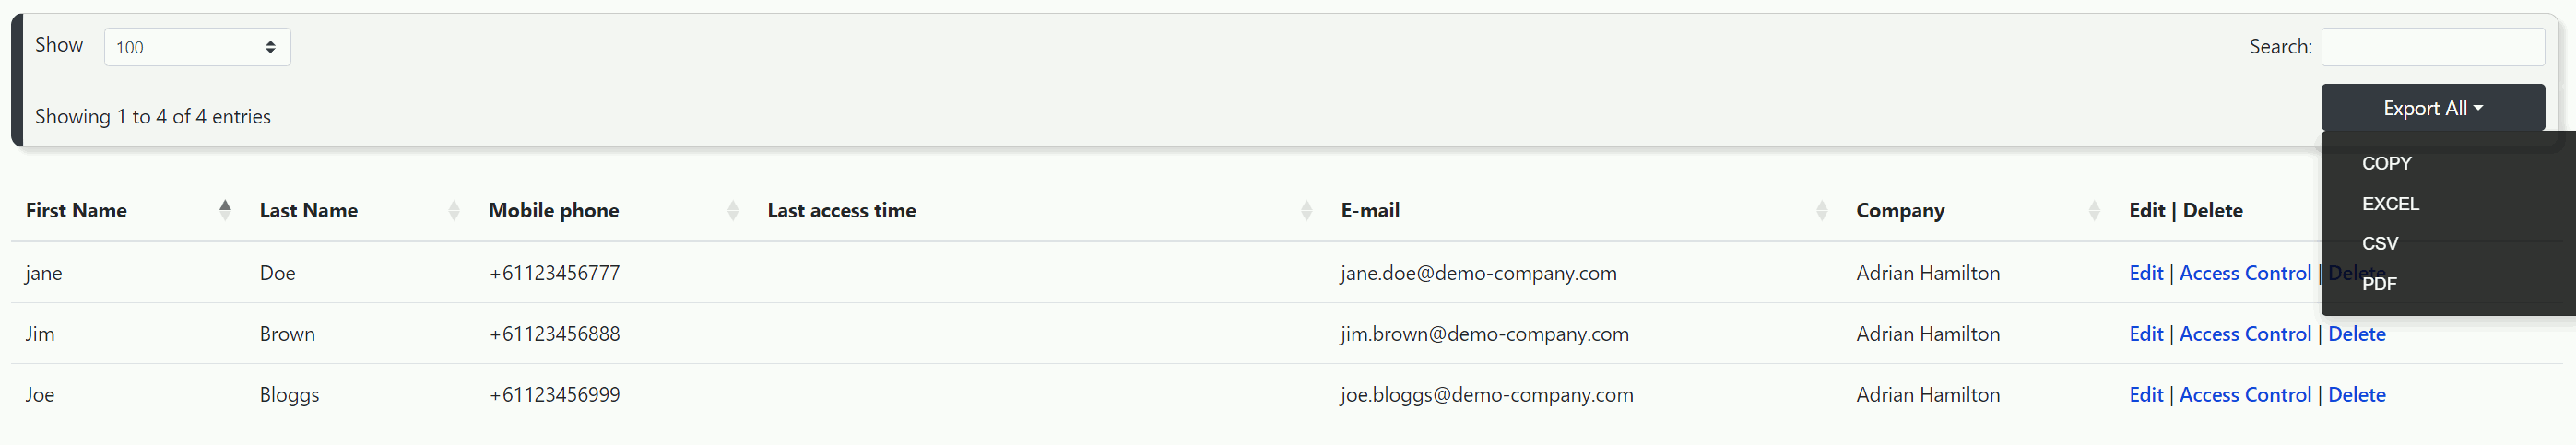
Index pages with large tables normally include search, column sorting, and export controls. Use the search field to filter records, select a column heading to change the sort order, or export the visible data to an available format such as Excel, CSV, or PDF.
Understanding Administrative Access
Each user account can have a different combination of roles and node access. Account owners generally receive the administration roles included with their plan, while invited users start without access until a company administrator assigns it.
A user with the Company Admin role can assign only the roles and nodes already available to their own account. See Section 6.2.3 - Configure User Access for the complete role descriptions and node access procedure.
6.2 - Company Admin
Users with the Company Admin role can manage linked users, assign roles and node access, configure notification groups, and manage other users’ dashboards.
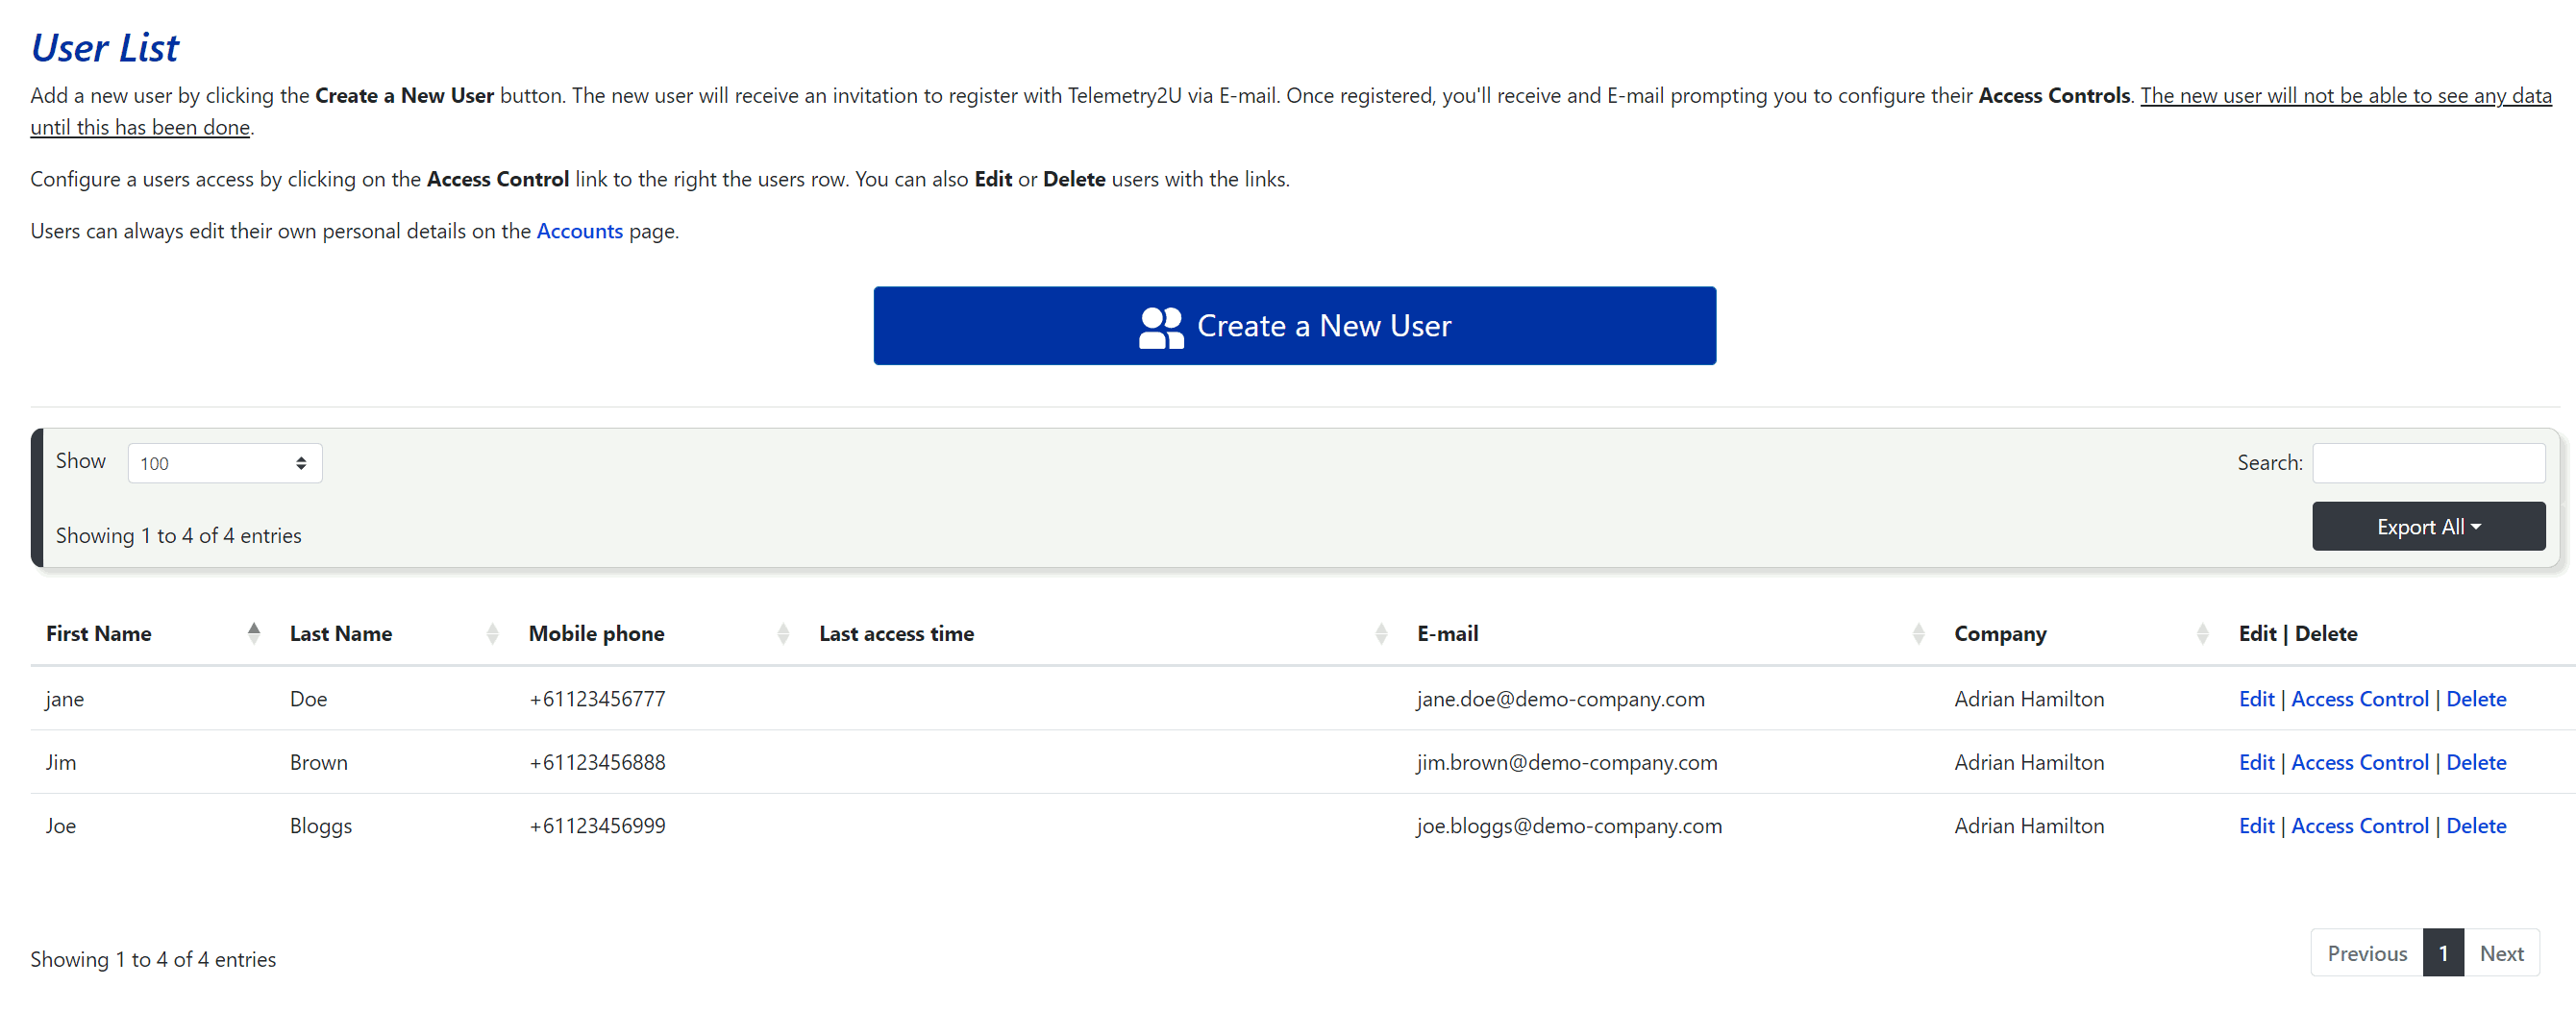
6.2.1 - User Maintenance
Open User Maintenance and select Add / Edit Users to view every user linked to the host account. The table shows contact information and the most recent sign-in time.
Use the actions on the right of a row to Edit or Delete a user, or open User Access to configure their roles and node visibility.
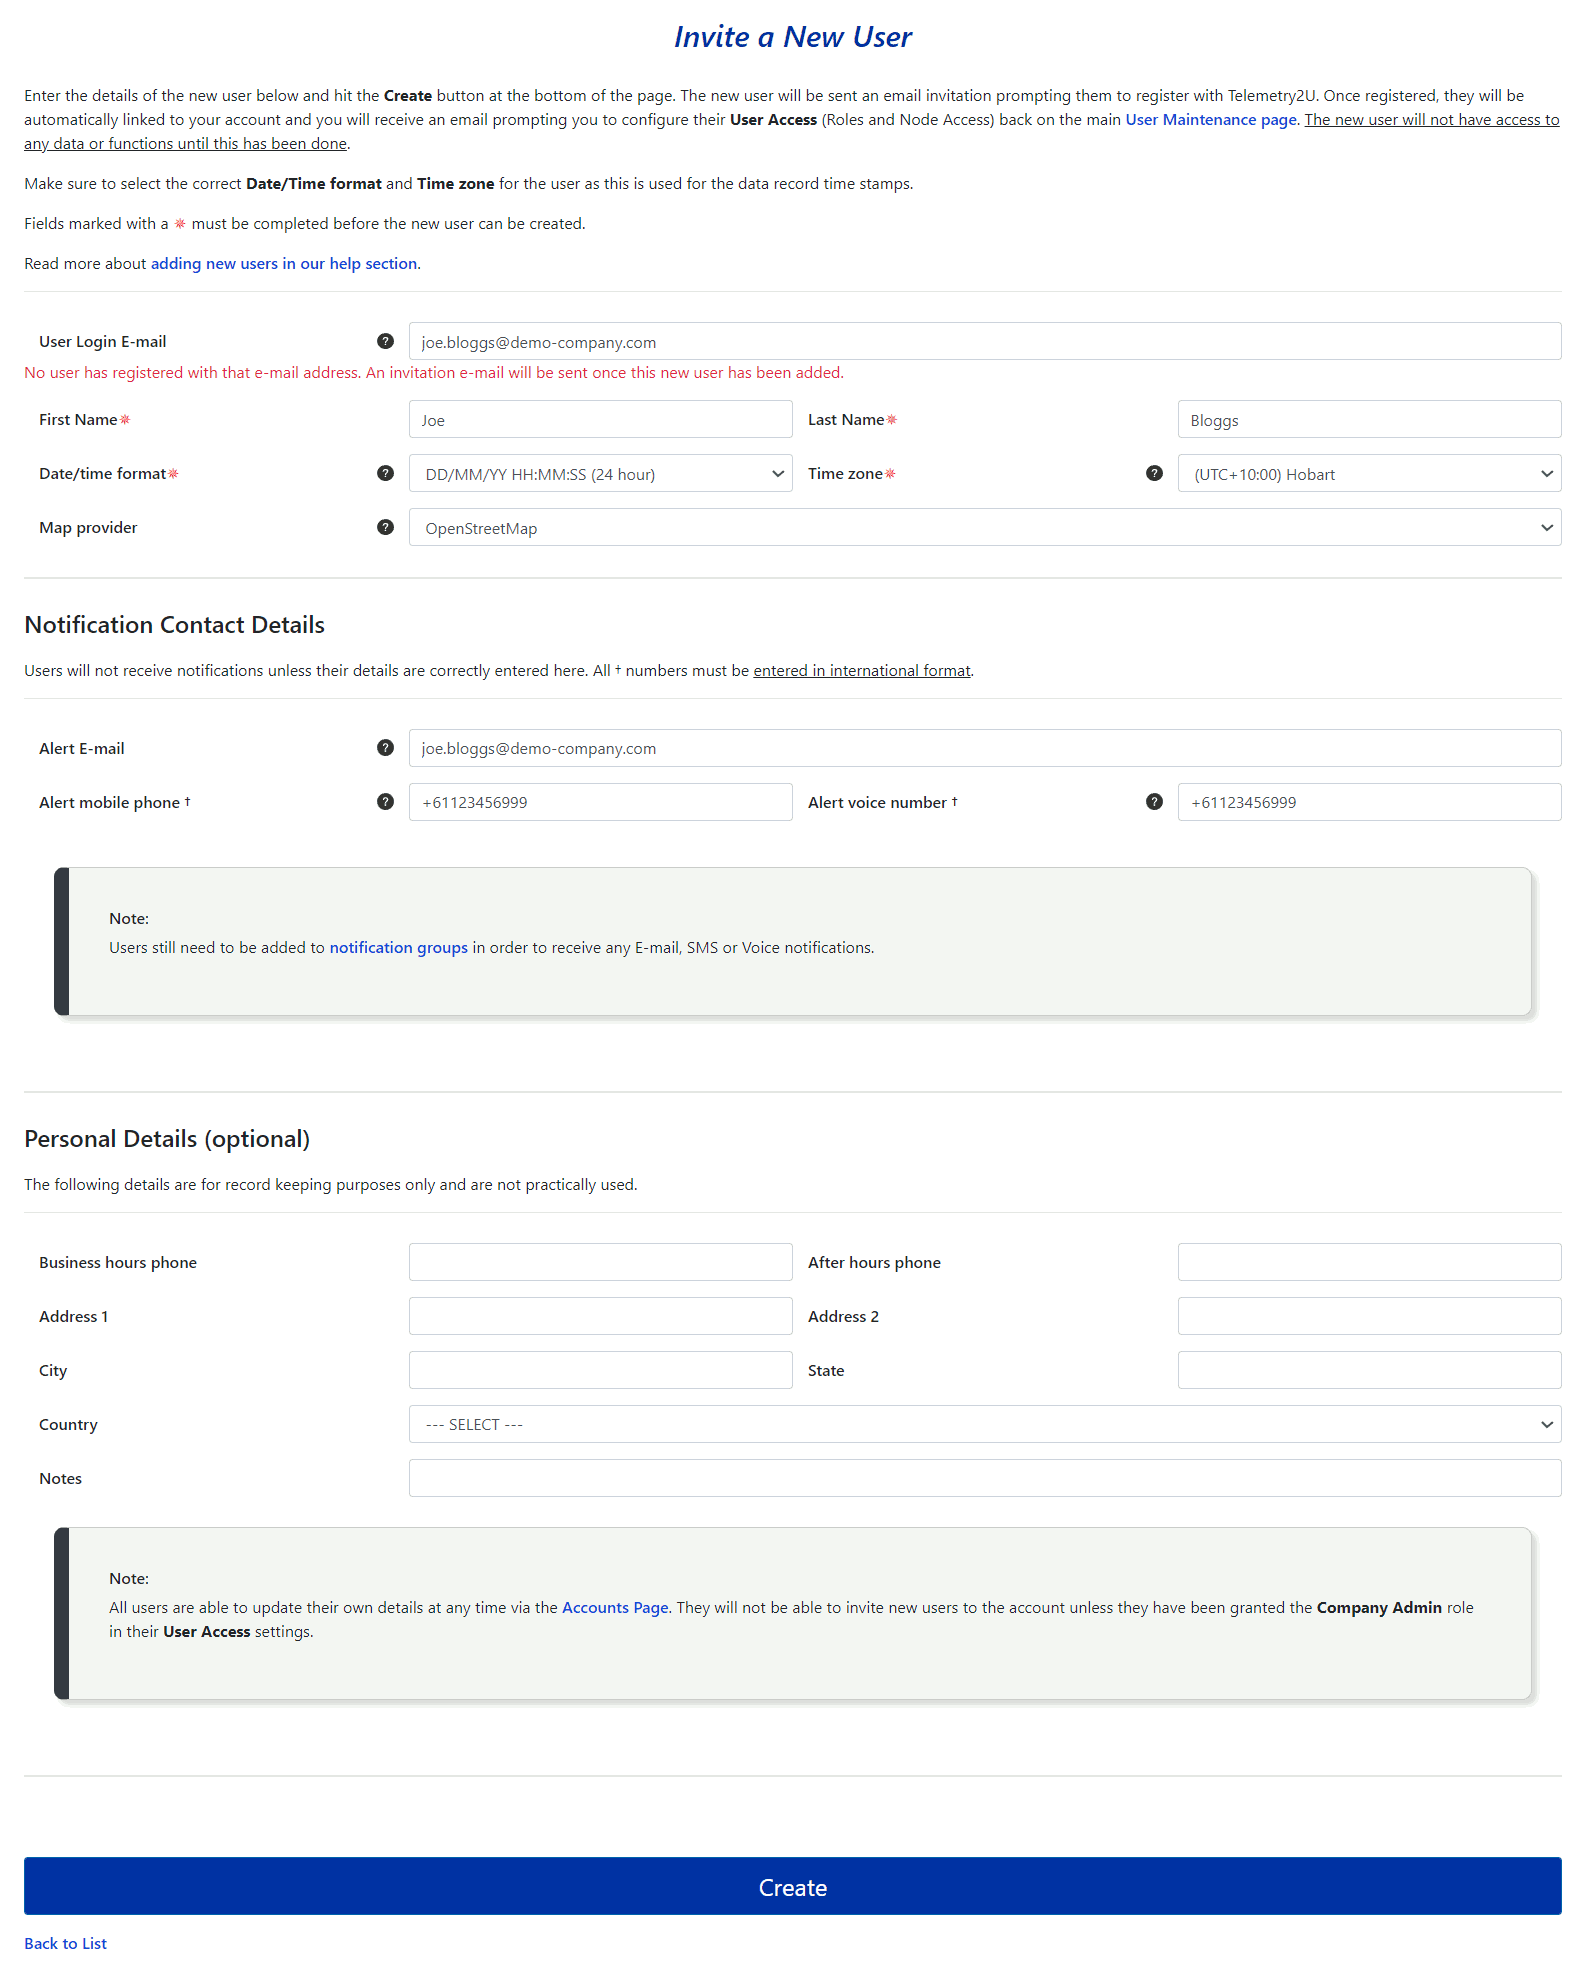
6.2.2 - Creating or Editing a User
Select Create a New User to invite a person to the account. Complete at least the following fields:
- User Login Email: the address that receives the invitation.
- First Name: the user’s first name.
- Last Name: the user’s last name.
- Date/time Format: the format used on pages and reports.
- Time Zone: the user’s local time zone, which may differ from the host account.
Complete the relevant fields under Notification Contact Details when the user must receive alert or device-down notifications:
- Alert Email: destination for email notifications.
- Alert SMS Number: mobile number for SMS notifications.
- Alert Voice Number: landline or mobile number for voice calls.
Select Create to send the invitation. The invitation links to the account registration page . After registration is complete, configure the user’s roles and node access before they can use account resources.
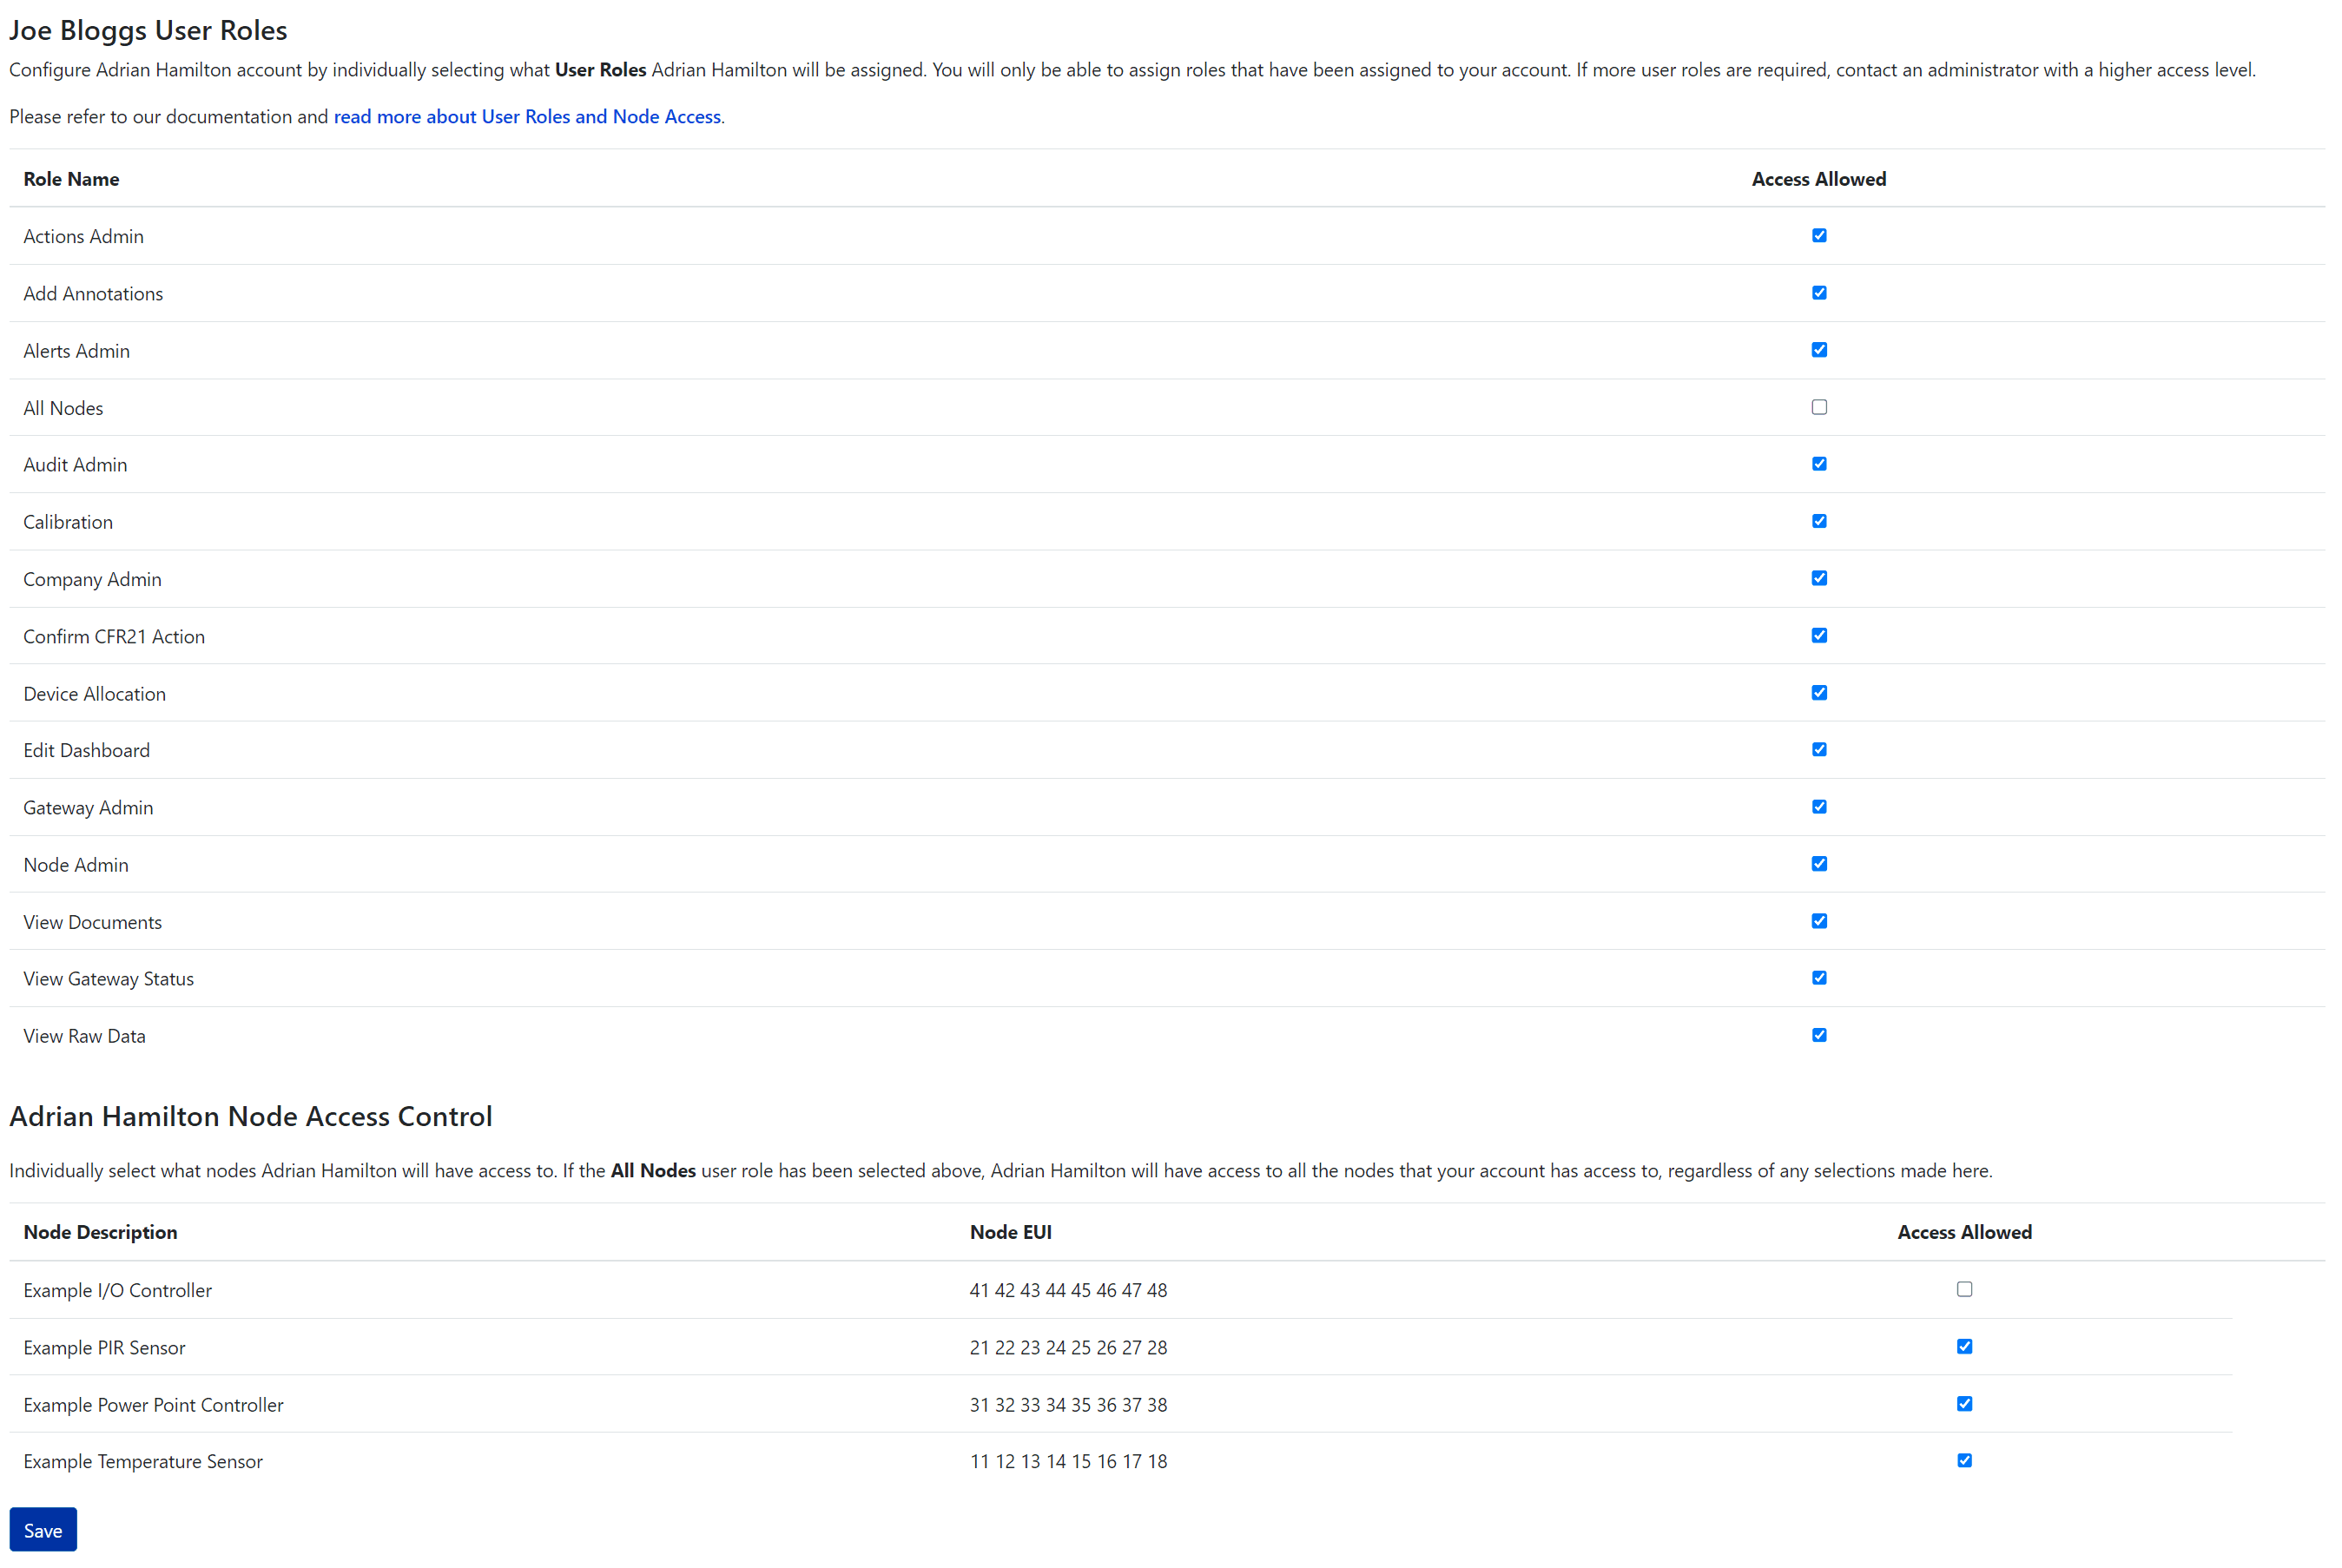
6.2.3 - Configure User Access
From the User Maintenance index, select User Access beside a user. New invited users have no roles or node access by default; assign each required role and either grant All Nodes or choose individual nodes under Node Access Control.
You can assign only roles and nodes available to your own account. Contact the account owner or platform administrator when additional access is required.
Actions Admin
Create command sequences that can run from alert conditions or schedules.
Add Annotations
Add and edit alert-event annotations shown in charts, reports, and audit reports.
Alert Admin
Create and maintain sensor alert groups, conditions, notifications, and actions.
All Nodes
Grant access to every node assigned to the host account.
Audit Admin
Create and edit audit report definitions. Other authorised users can download the reports.
Calibration
Apply two-point, three-point, and offset calibrations and manage calibration documents.
Company Admin
Manage users, roles, node access, notification groups, and users’ dashboards.
Confirm CFR21 Action
Confirm protected administration changes by re-entering credentials where 21 CFR Part 11 controls are enabled.
Device Allocation
Add and edit LoRaWAN and cellular end devices, including connection-critical fields.
Edit Dashboard
Create and modify dashboards. A dashboard can be edited only by its creator unless copied.
Gateway Admin
Add and edit gateways and configure supported public-network integrations.
Node Admin
Edit non-critical node information and send available downlink commands.
View Documents
View and download documents attached to nodes, including calibration certificates.
View Gateway Status
Review the connection status of LoRaWAN gateways assigned to the account.
View Raw Data
View raw hexadecimal sensor packets from the Reports page.
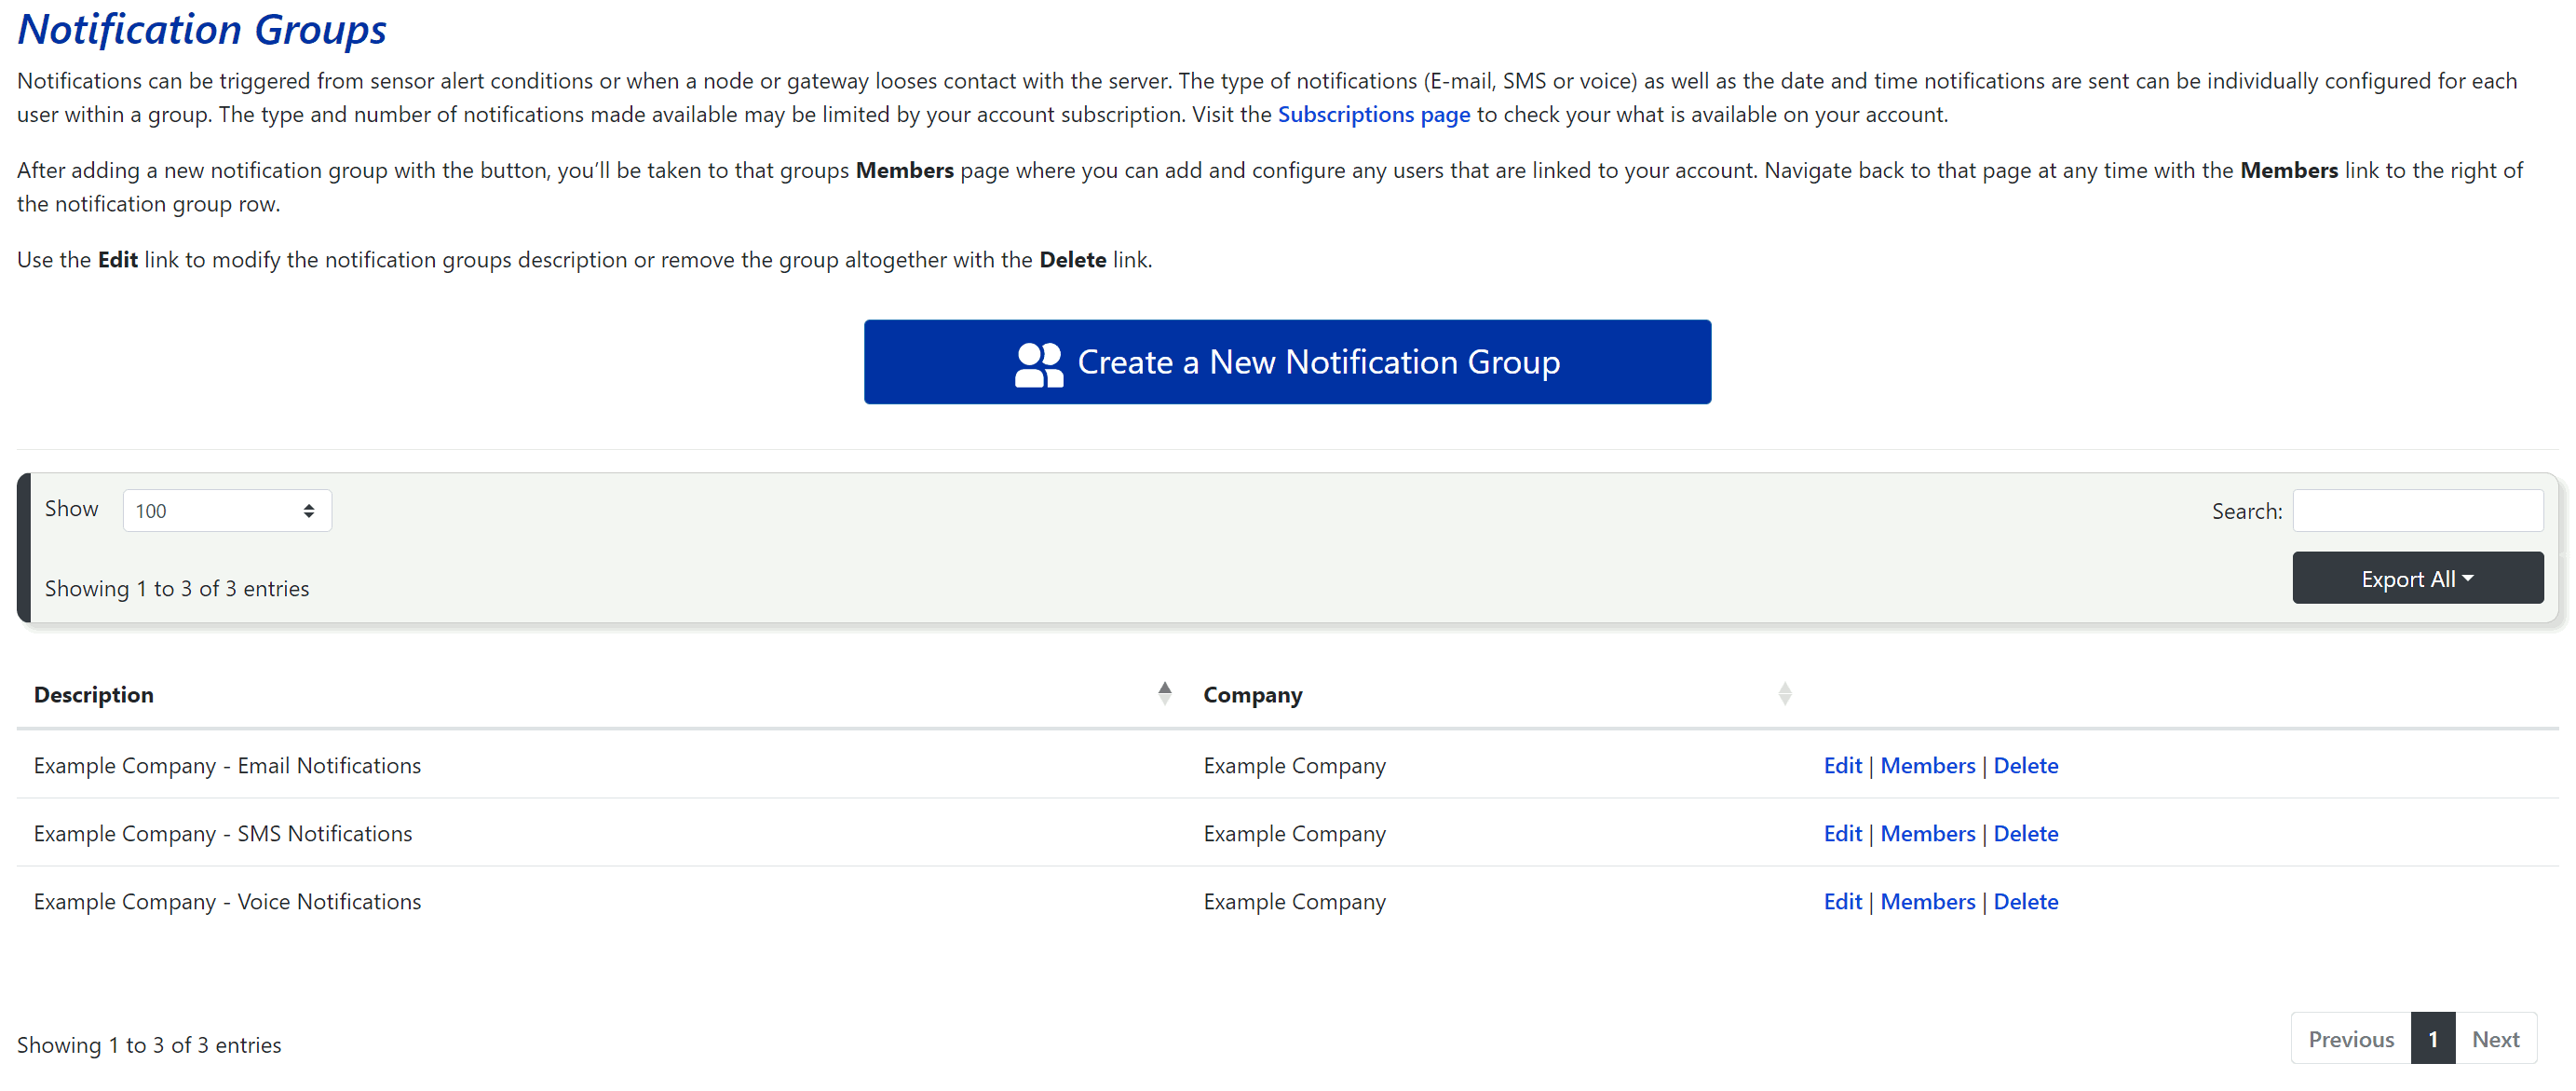
6.2.4 - Notification Groups
Notification groups contain users who can receive email, SMS, voice, or app notifications from alert conditions and node- or gateway-down rules. Open Add / Edit Notification Groups to view existing groups.
Use Edit or Delete beside a group, or select Members to configure its users. Select Create a New Notification Group to add another group.
A new host account normally includes three groups:
- Company Name - Email Notifications
- Company Name - SMS Notifications
- Company Name - Voice Notifications
The account creator is added to the default groups, with the matching notification type and an initial 24-hour, seven-day schedule.
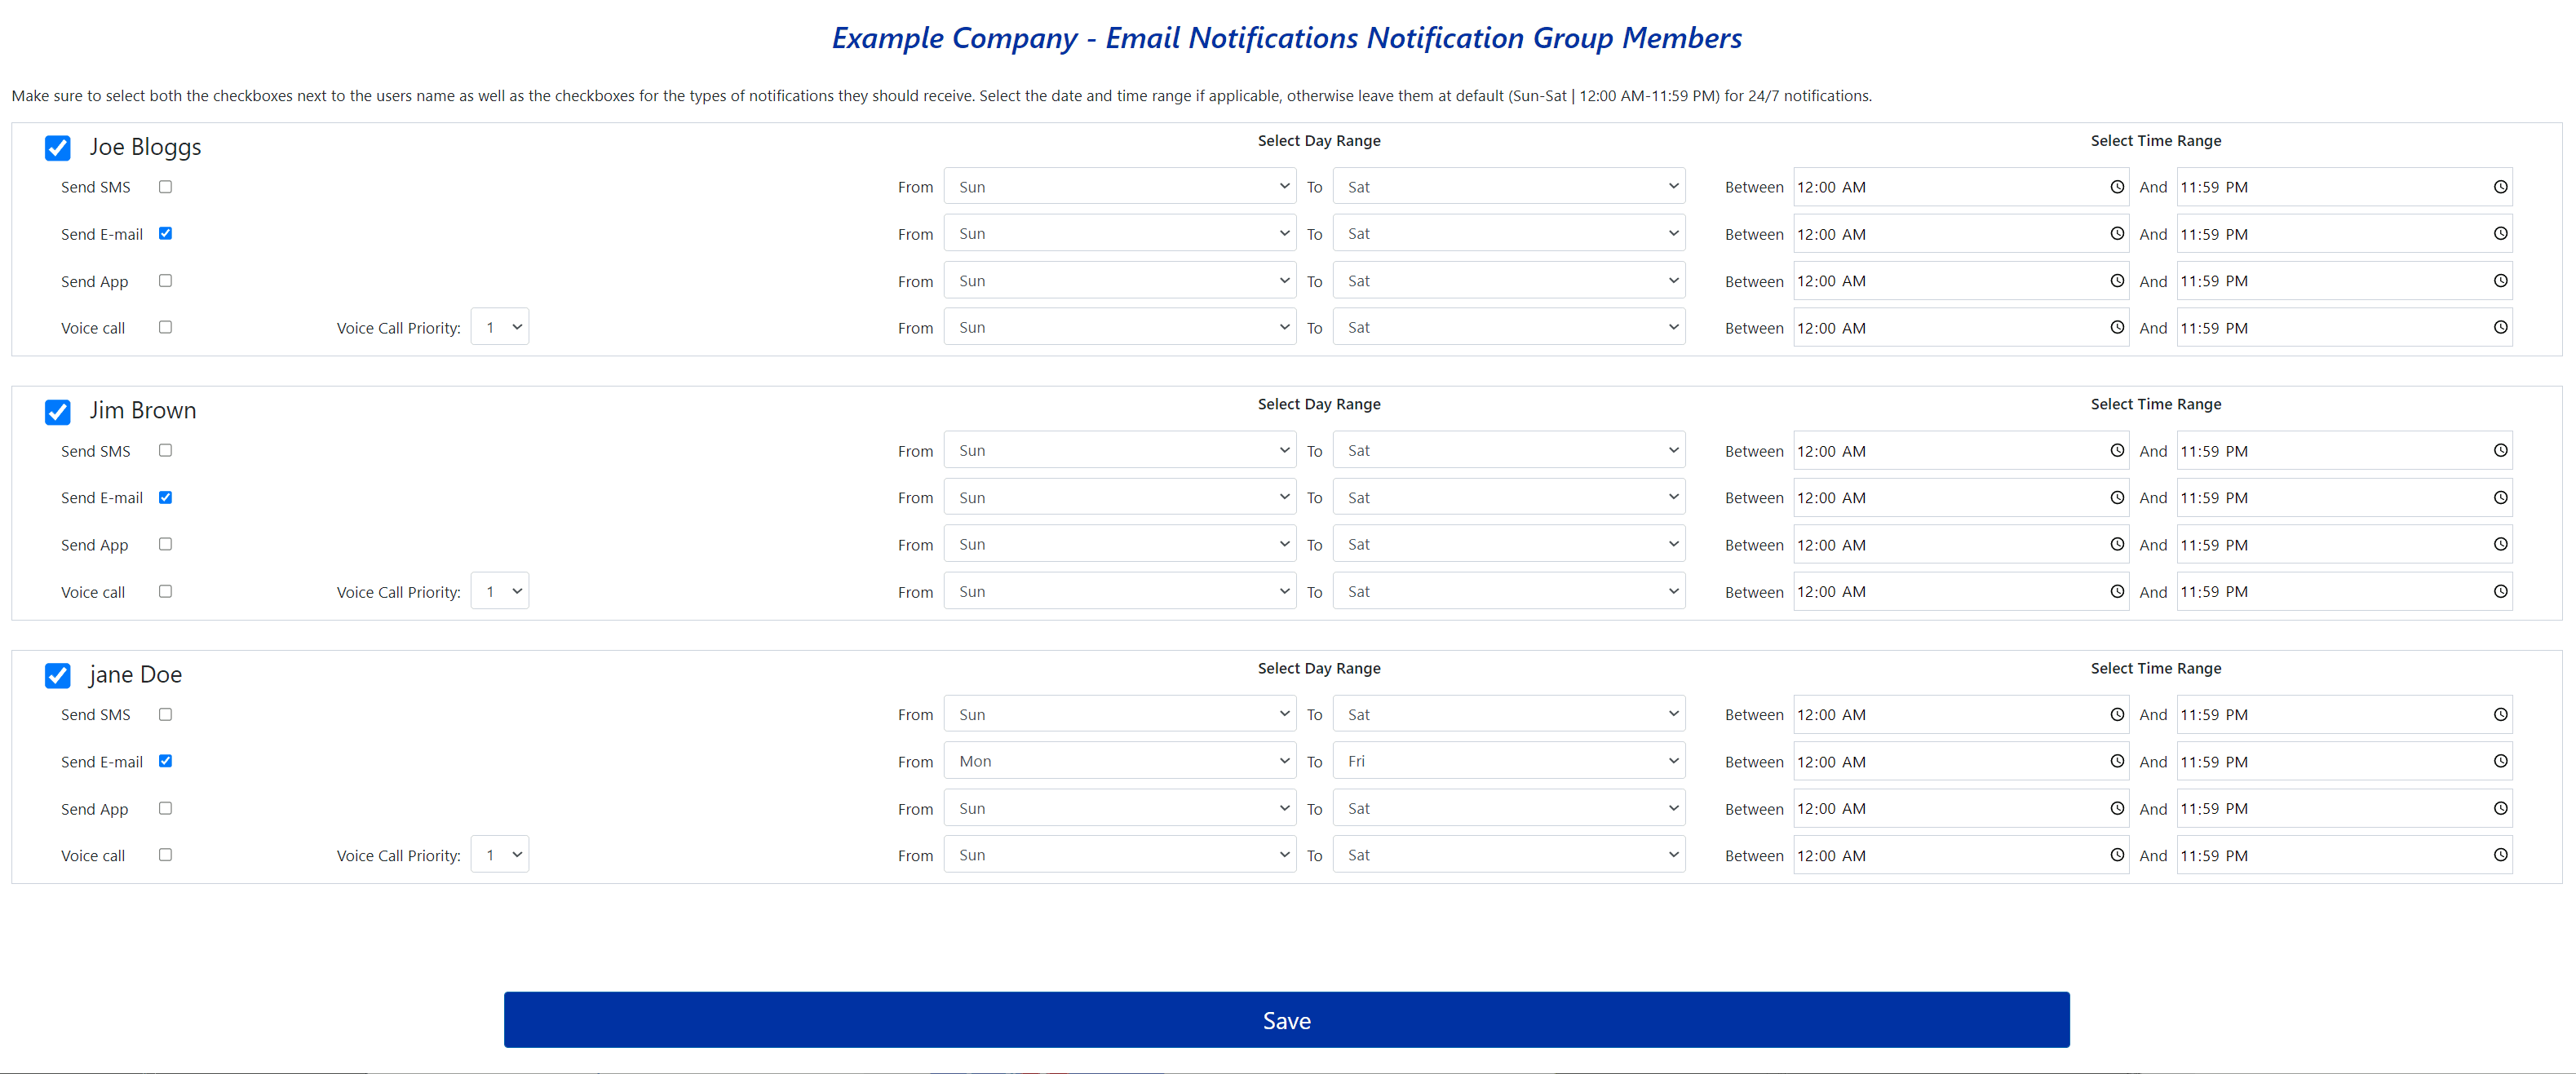
6.2.5 - Notification Group Members
Select Members beside a notification group, or continue from a newly created group, to select its users and notification channels.
- Email: sent immediately, although receipt can be delayed by the recipient’s mail service.
- SMS: normally sent immediately when SMS is enabled for the account.
- Voice Calls: normally initiated immediately when voice calling is enabled.
- App Notifications: sent to devices where the platform app and push notifications are configured.
Use the day and time filters to control when each member receives each type of message. The initial schedule is Sunday to Saturday, 12:00 AM to 11:59 PM.
Voice Call Priority controls the call order. The recipient is prompted to confirm receipt using the keypad. If no confirmation is received, the system advances to the next person and can repeat the sequence up to five times.
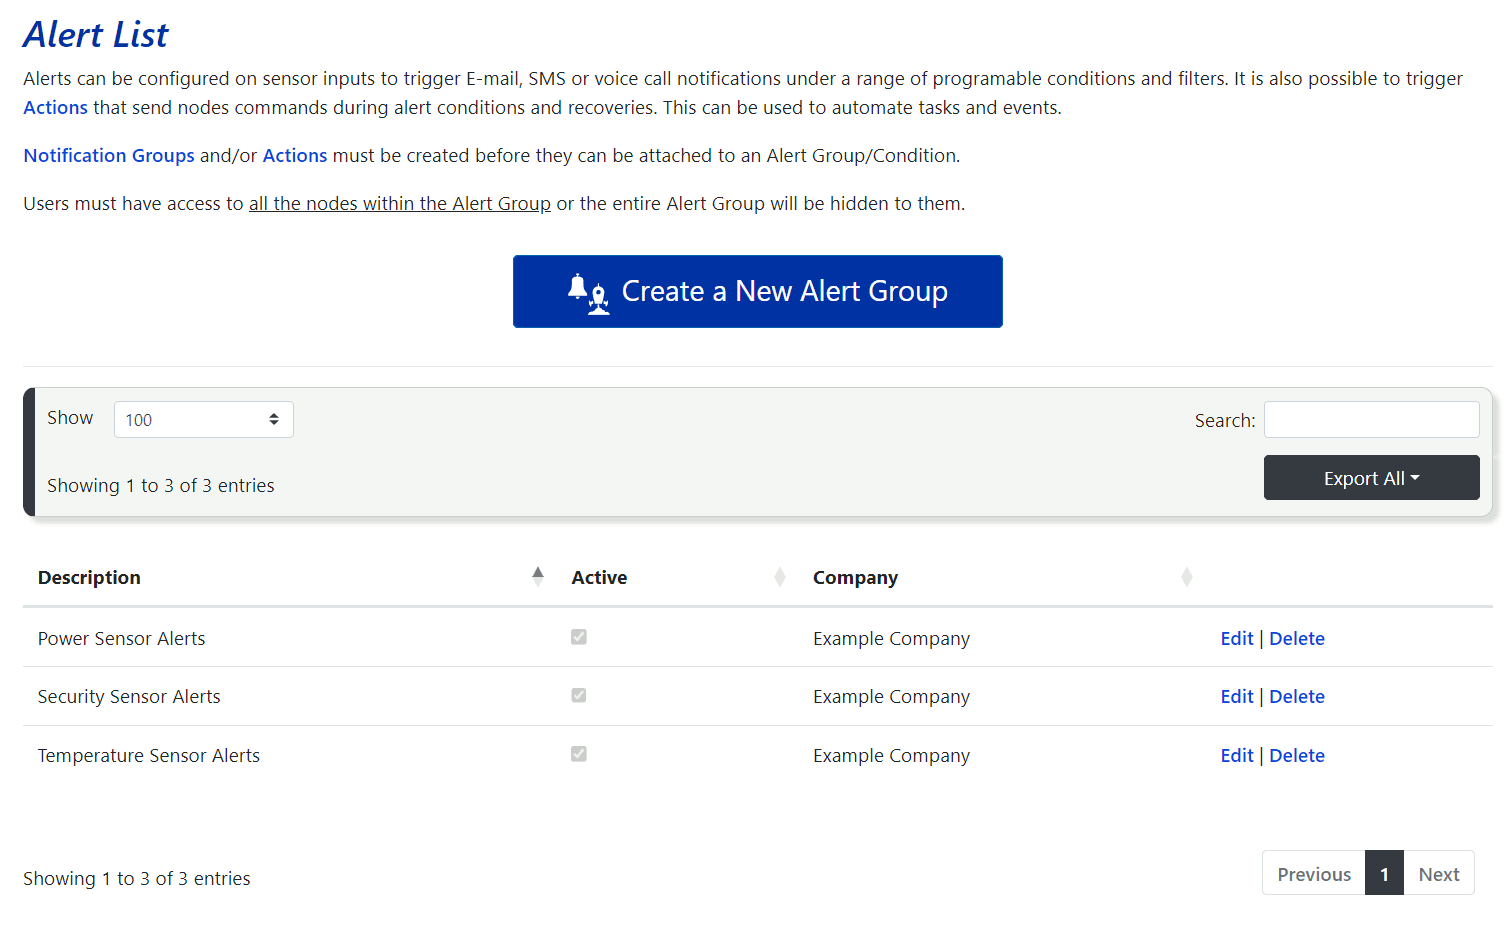
6.3 - Alert Admin
Alert groups compare sensor readings with configured conditions, notify selected groups, and optionally run downlink actions when an alert starts or recovers.
Users with the Alert Admin role can open Add / Edit Alerts and Conditions. Configure the required notification groups and actions before building alert conditions.
The Alert Groups index shows every group and whether it is active. Use Edit or Delete beside a row, or select Create a New Alert Group. The create and edit forms contain the same settings.
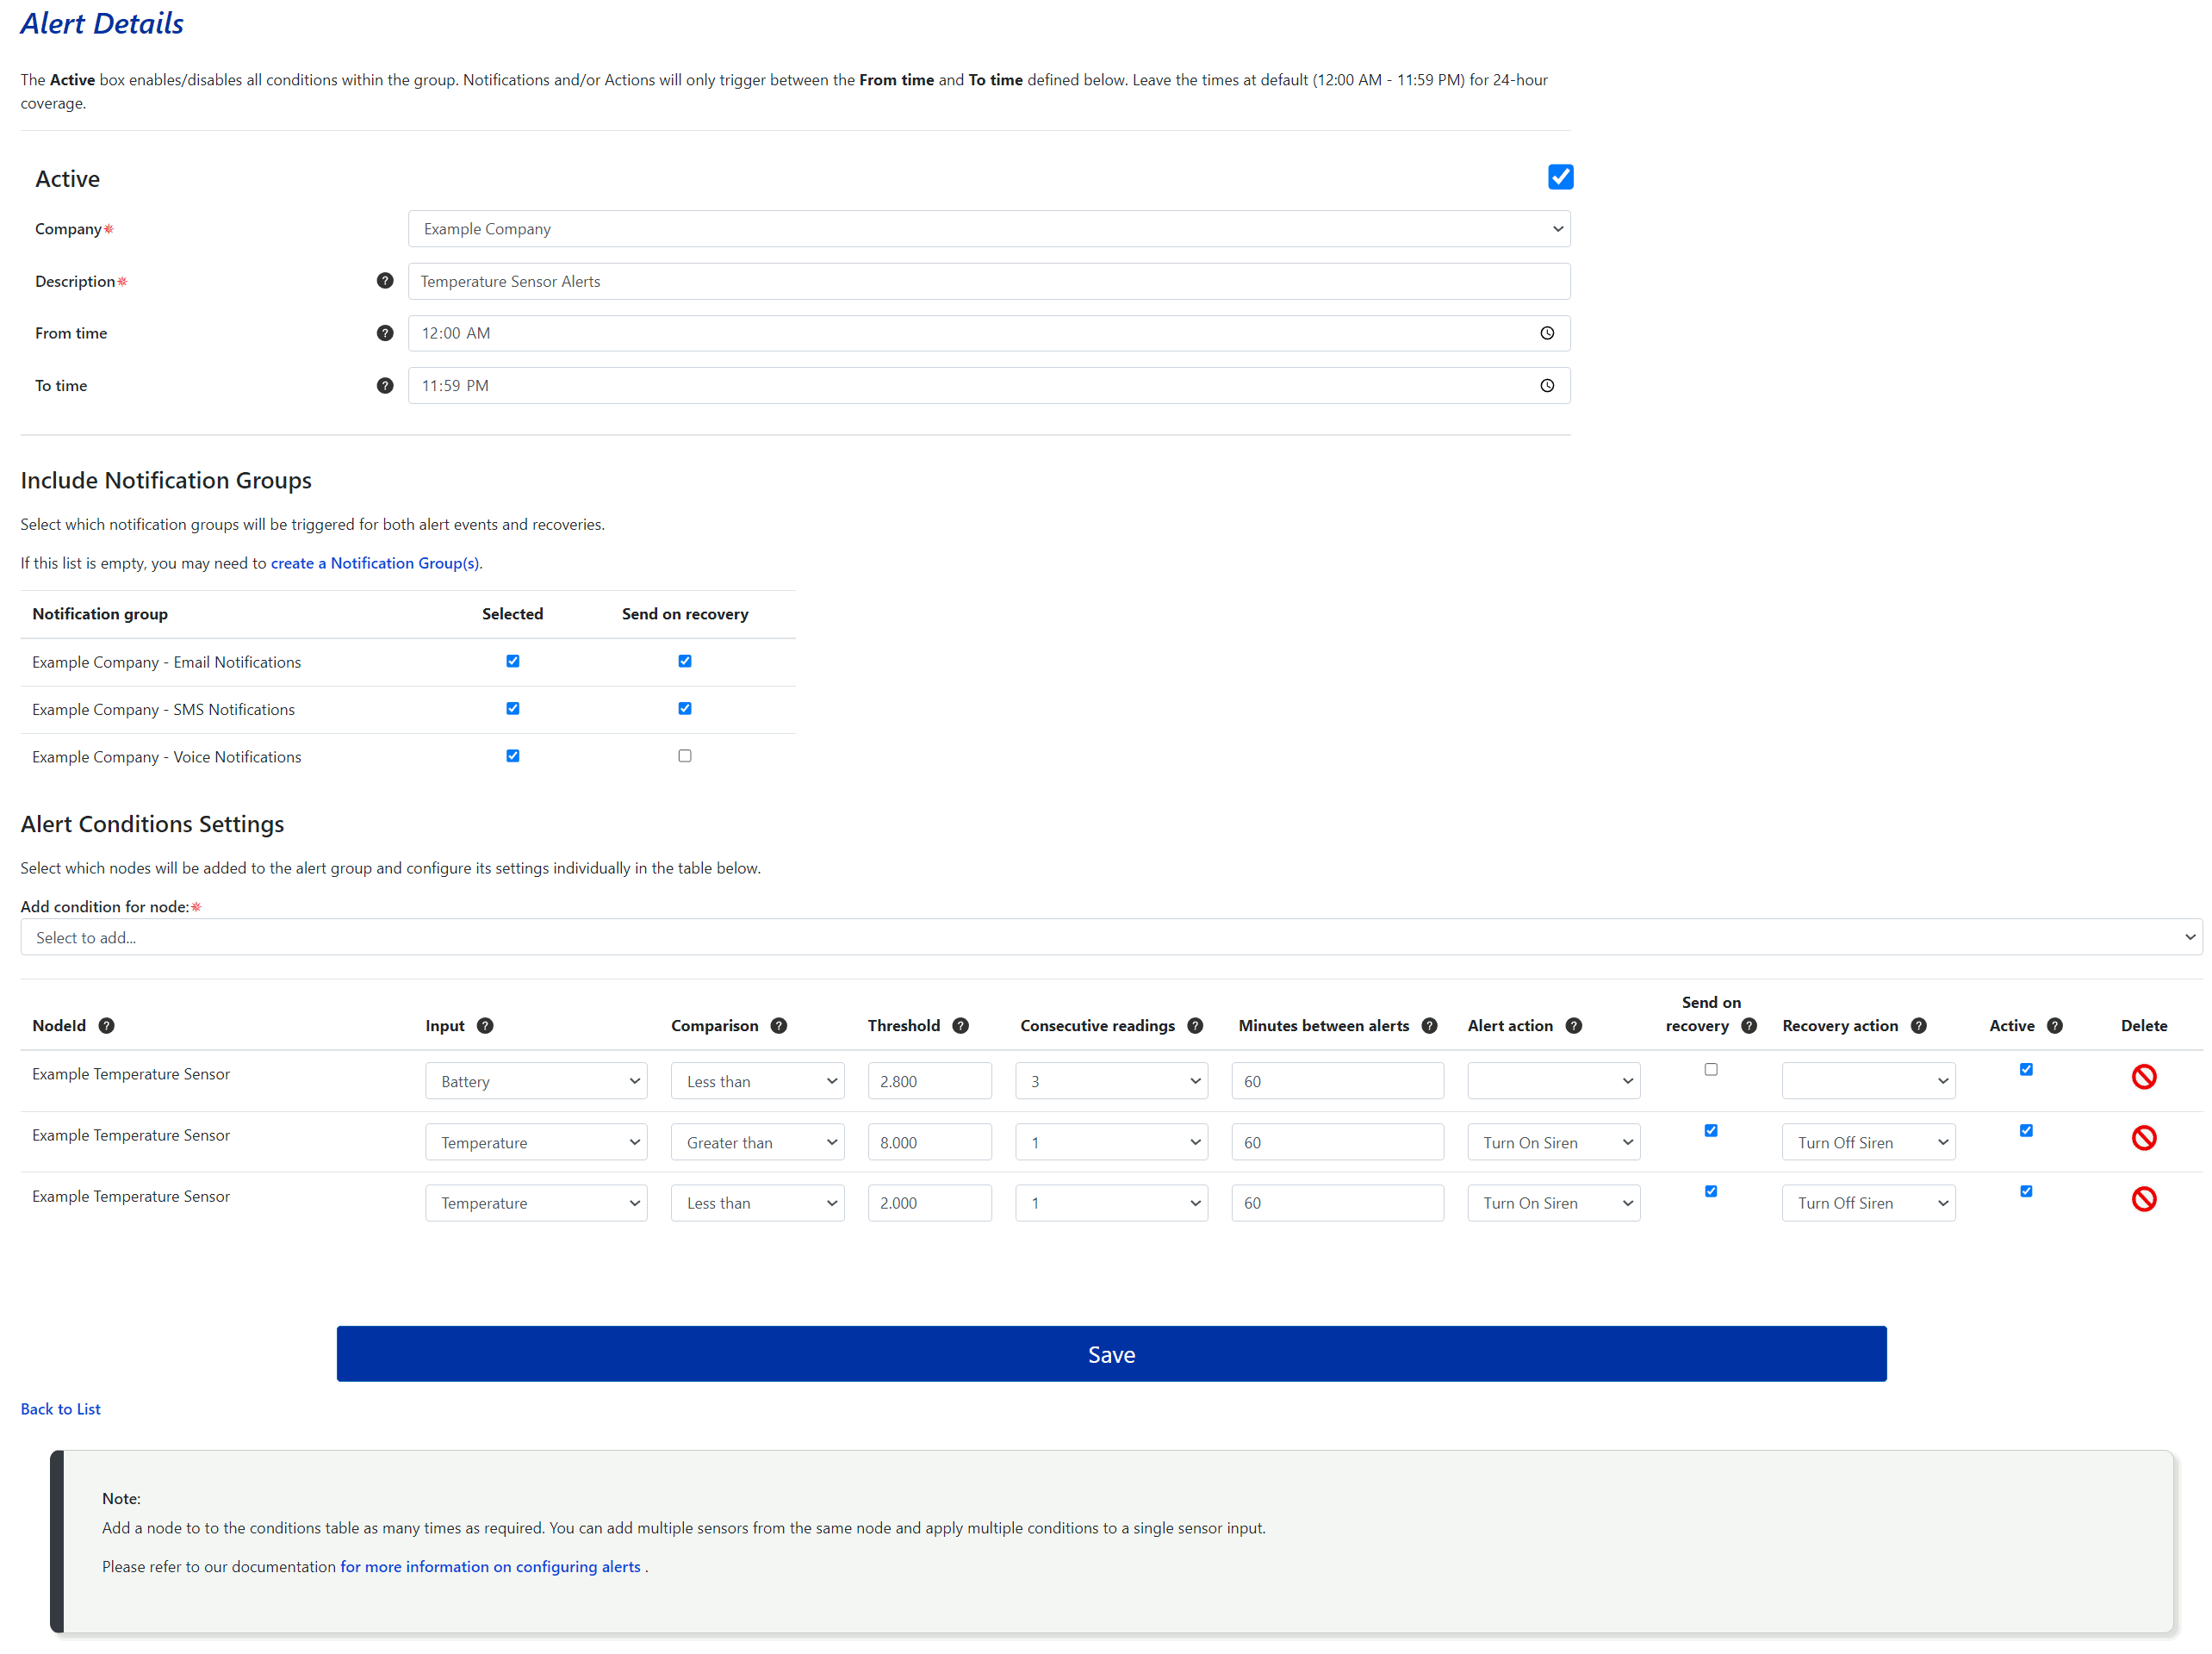
6.3.1 - Creating and Editing Alerts
1. Description and Time Filters
Name the group and define when it can trigger. The initial period is 12:00 AM to 11:59 PM. Outside the configured time range, notifications and actions do not run.
2. Notification Groups
Select the groups to notify. Without a selected group, email, SMS, voice, and app notifications are not sent, but configured actions can still run. Enable Send on Recovery to notify users when the condition returns to normal.
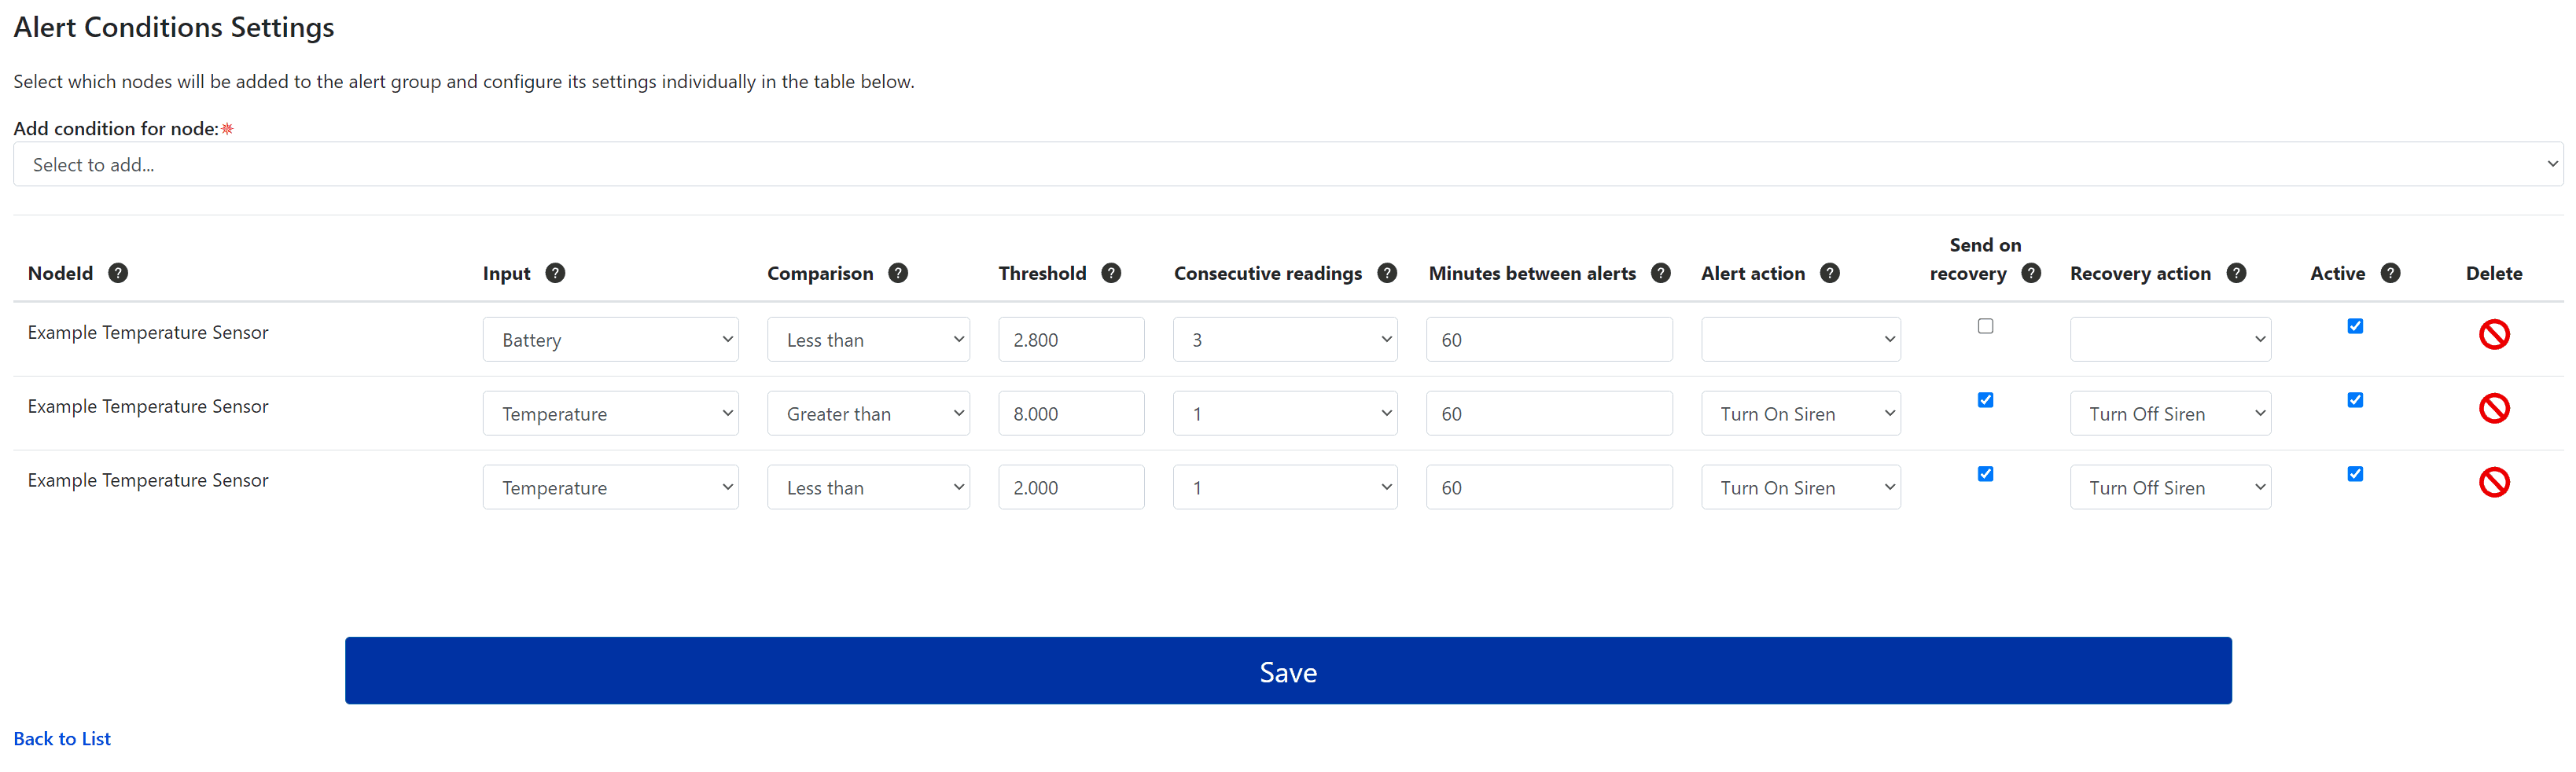
3. Alert Conditions
Select a node to add its sensors to the condition table, then configure the input, comparison, threshold, repeat controls, and alert or recovery actions.
Alert condition fields
- Input: the sensor input evaluated by the condition.
-
Comparison: how the latest reading is evaluated:
- Less than: reading is below the threshold.
- Less than or equal to: reading is at or below the threshold.
- Equal to: reading matches the threshold.
- Greater than: reading is above the threshold.
- Greater than or equal to: reading is at or above the threshold.
- Value changed: reading differs from the previous record.
- Value not changed: reading matches the previous record.
- Change below: reading has decreased beyond the configured change threshold.
- Change above: reading has increased beyond the configured change threshold.
- Threshold: the comparison value.
- Consecutive Readings: the number of consecutive out-of-range readings, from one to three, required before the alert triggers. Select All to trigger on every out-of-range reading.
- Minutes Between Alerts: minimum interval between repeated alerts, reducing repeated messages when a reading fluctuates around the threshold.
- Alert Action: action group run when the condition enters the alert state.
- Send on Recovery: sends recovery notifications and permits the recovery action to run.
- Recovery Action: action group run when the reading returns to its normal range.
- Active: enables or disables the condition without deleting it.
- Delete: permanently removes the condition.
Select Save after completing the group. To edit it later, return to Add / Edit Alert Groups and select Edit beside the row.
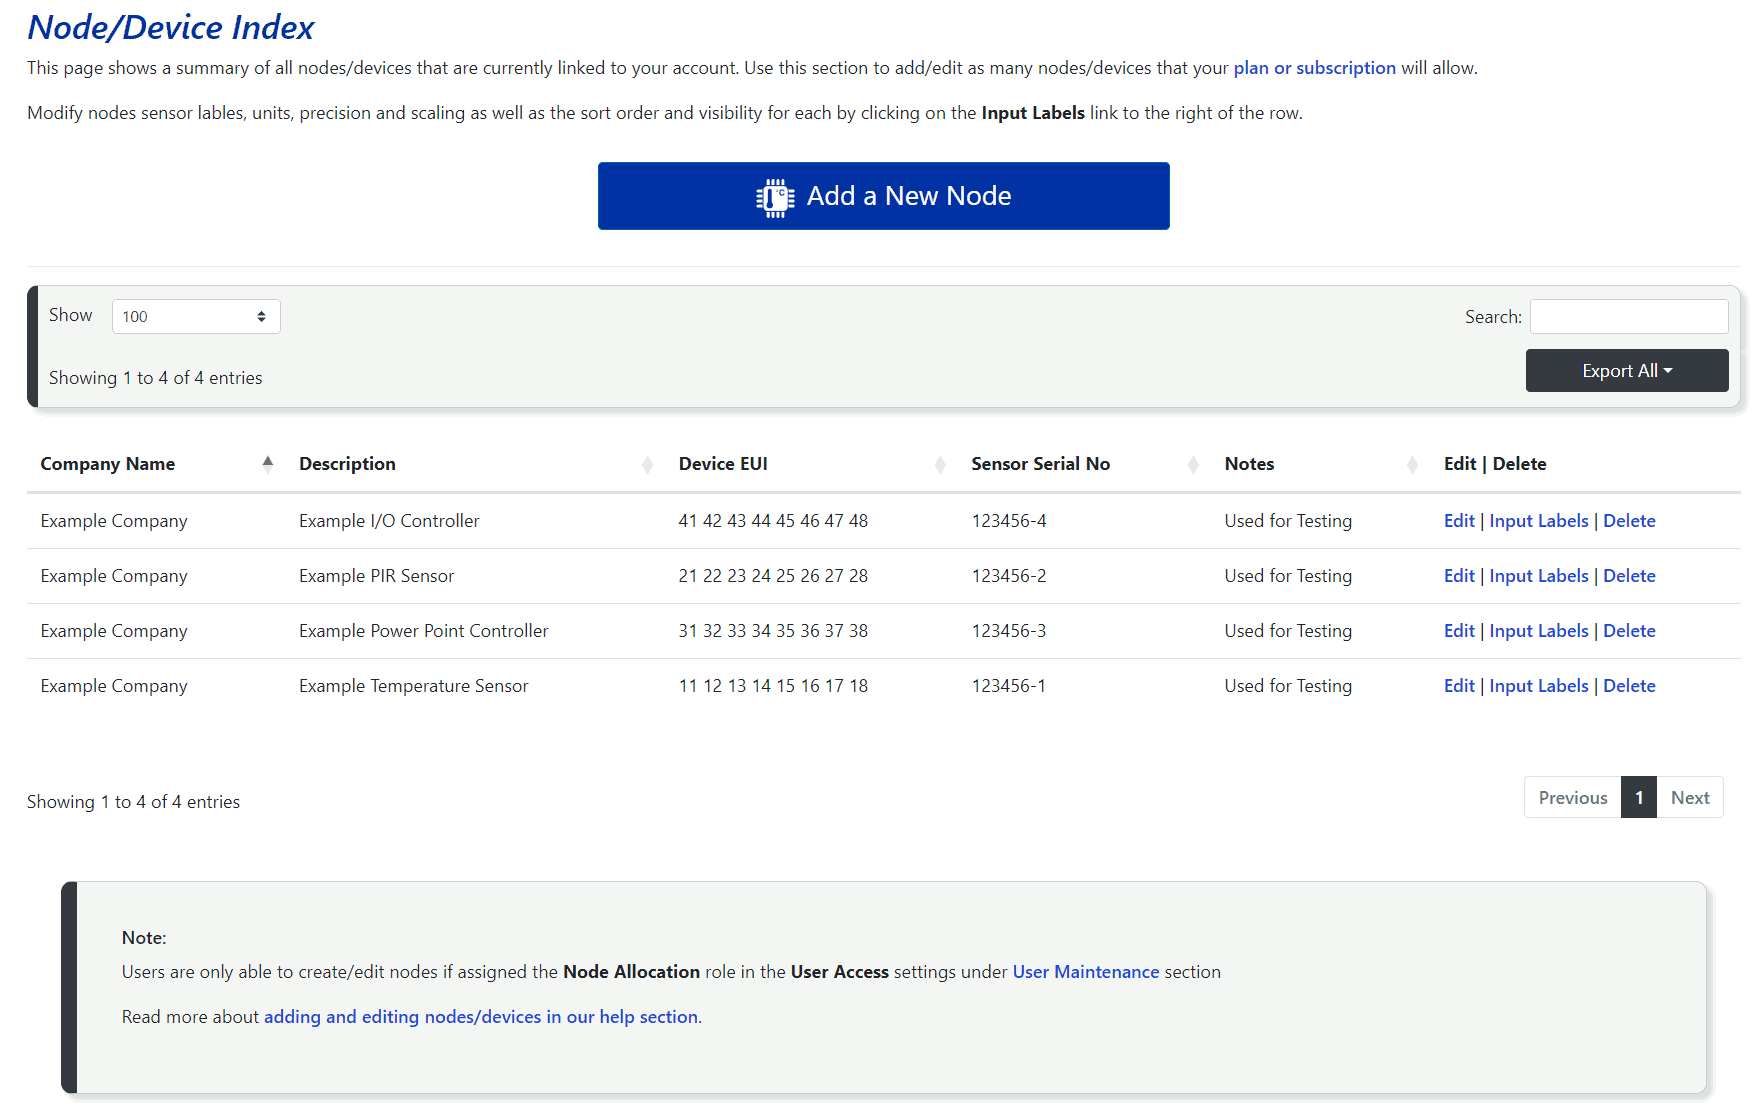
6.4 - Node Admin
Add and maintain LoRaWAN and cellular end devices, rename and scale sensor inputs, send downlink commands, and create custom payload decoders and command templates.
Device Allocation permits changes to connection-critical fields. Node Admin permits non-critical maintenance such as descriptions, notes, input labels, and available commands.
Open Add / Edit End Devices to view every LoRaWAN and cellular node linked to the account. Use Edit or Delete beside a row, or open Input Labels to rename, scale, hide, and sort sensor inputs.
Select Add a New Node to create another device. The number of devices available may depend on the subscription or custom account plan.
6.4.1 - Creating and Editing Nodes
Configure the end device before adding it. A LoRaWAN node must use the same frequency
plan as the receiving gateway. A cellular UDP device must use server address
150.101.108.130 and UDP port 4483. For a public LoRaWAN network,
configure the matching integration described in Section 6.8.
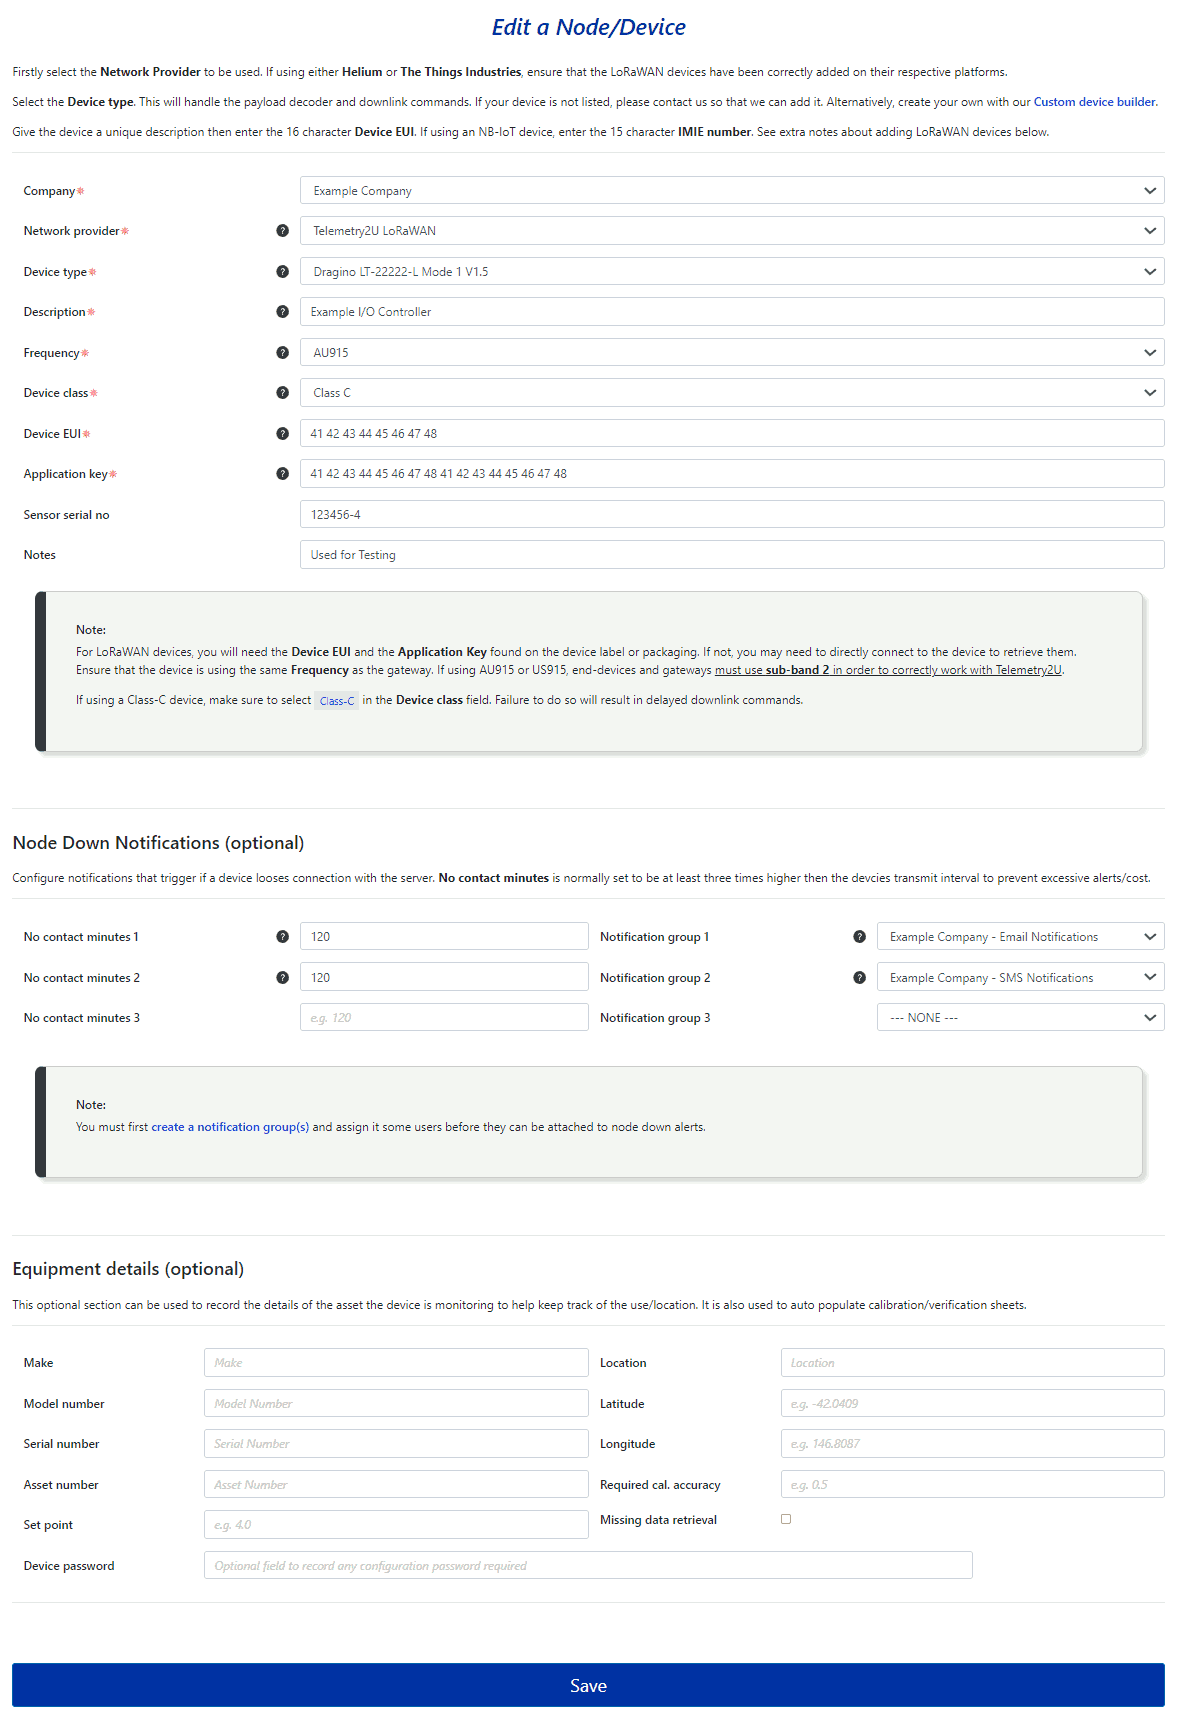
1. Node Details
- Network Provider: select the connection path. Available choices can include private Telemetry2U LoRaWAN, Telemetry2U cellular UDP, Helium LoRaWAN, and The Things Network or The Things Industries.
- Device Type: selects the payload decoder and available downlink command list. Use an existing type or create a custom template in Section 6.4.4.
- Description: unique device name displayed across the platform.
- Frequency: LoRaWAN frequency plan; it must match the gateway.
- Device Class: LoRaWAN class used by the device.
- Device EUI: 16-character LoRaWAN Device EUI, or the 15-digit IMEI for a cellular device.
- Application Key: 32-character LoRaWAN application key. It is not used for cellular devices or devices integrated through supported public networks.
- Sensor Serial No.: optional serial number used on calibration certificates.
- Notes: optional device notes displayed on the node table.
2. Node Down Notifications
- No Contact Minutes: time without contact before the rule triggers.
- Notification Group: group notified when the no-contact time is reached.
Two independently configured notification groups can be used. A recovery message is also sent when the node reconnects.
3. Equipment Details
The optional equipment fields record information about the asset being monitored or controlled and can populate generated calibration certificates.
Select Save after completing the form.
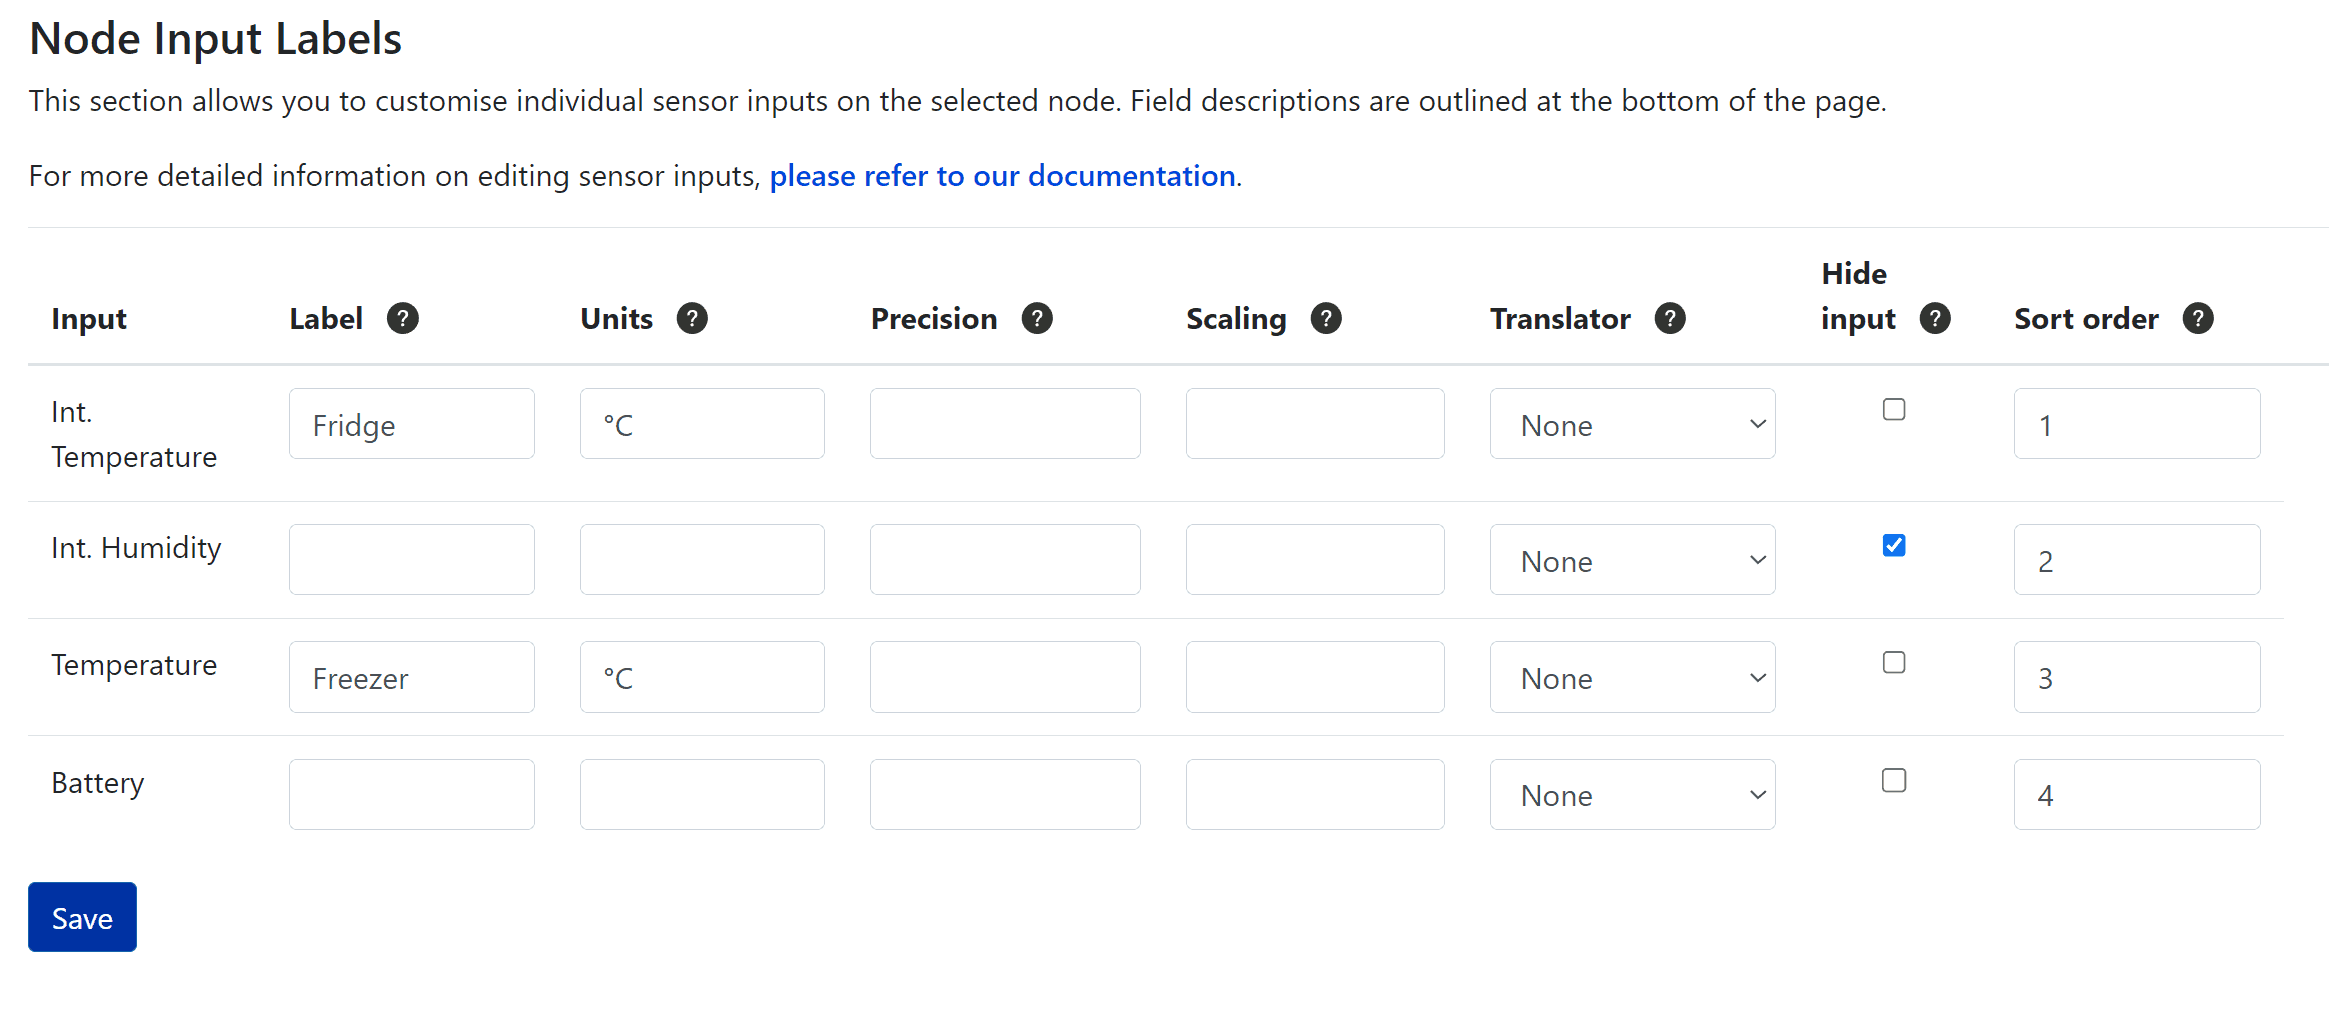
6.4.2 - Renaming, Hiding and Sorting Sensor Inputs
From Nodes and Devices > Add / Edit End Devices, select Input Labels beside a node and configure:
- Input: sensor input provided by the device type.
- Label: displayed sensor name; overrides the decoder description.
- Units: displayed unit; overrides the decoder unit.
- Precision: number of decimal places.
- Scaling: multiplier applied to the decoded value.
- Translator: converts binary values into labels such as On/Off or Yes/No.
- Hide Input: removes the input from platform pages and lists.
- Sort Order: controls the input order on charts and reports.
Select Save to apply the changes immediately.
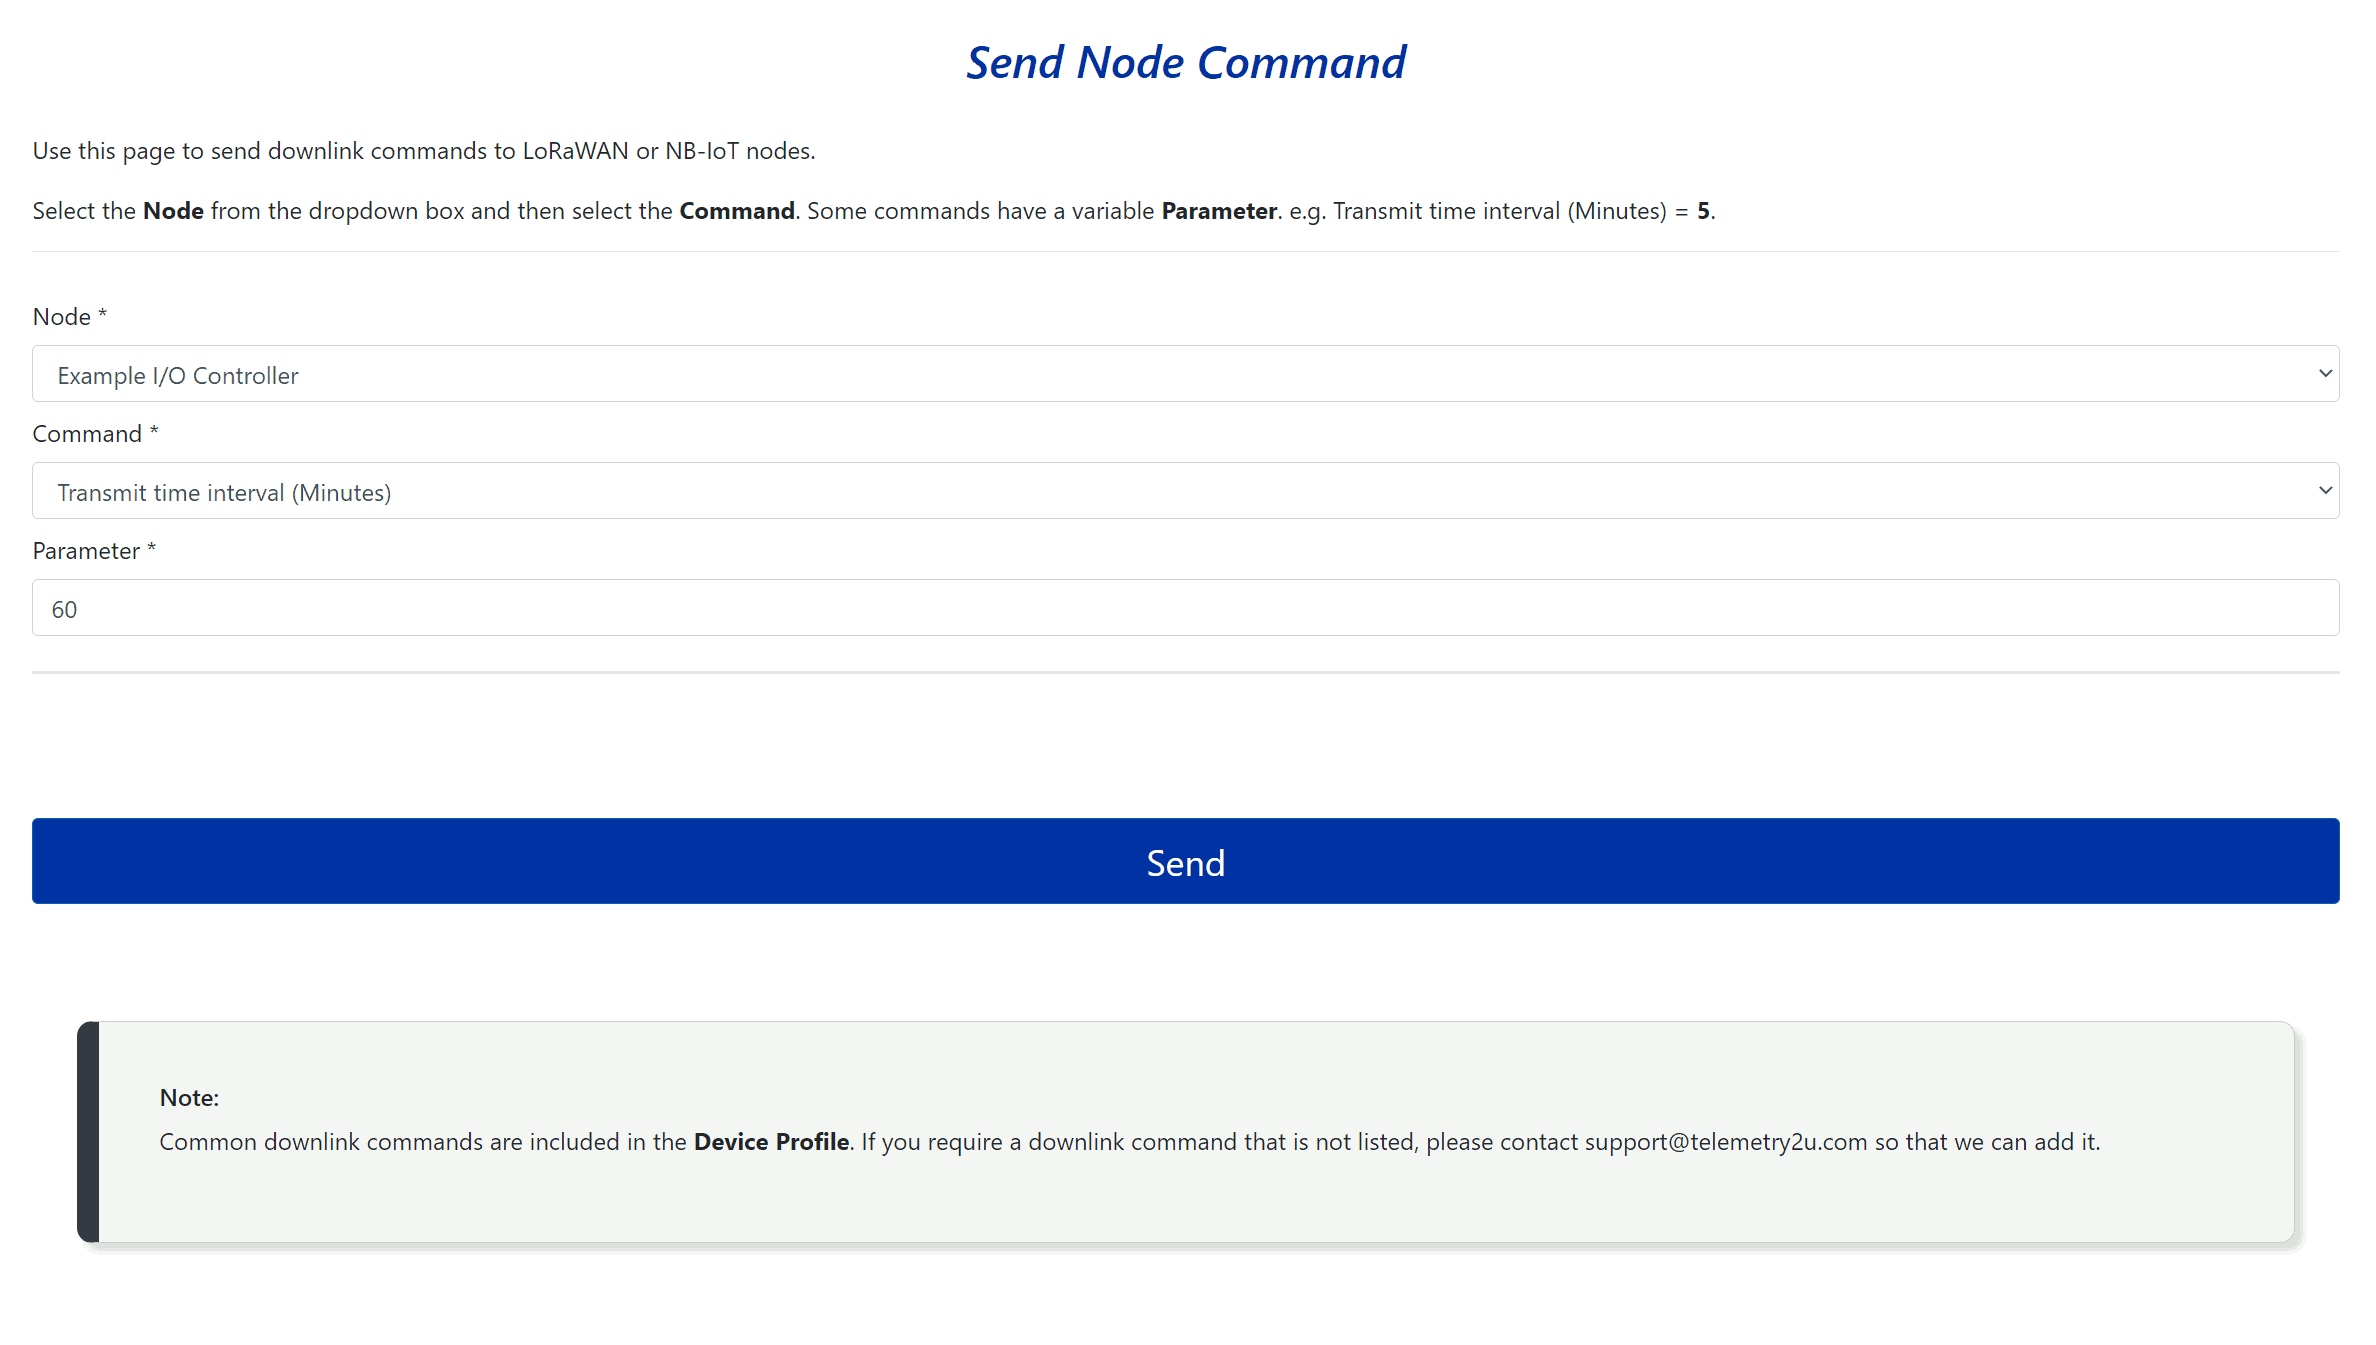
6.4.3 - Sending Downlink Commands
Users with Node Admin can open Send Downlink Command and send a supported command to a LoRaWAN or cellular device.
- Node: device that will receive the command.
- Command: command supplied by the selected device type.
- Parameter: optional value required by some commands.
Class A LoRaWAN devices receive queued commands after their next uplink. Class C devices normally receive commands sooner because their receive window remains open.
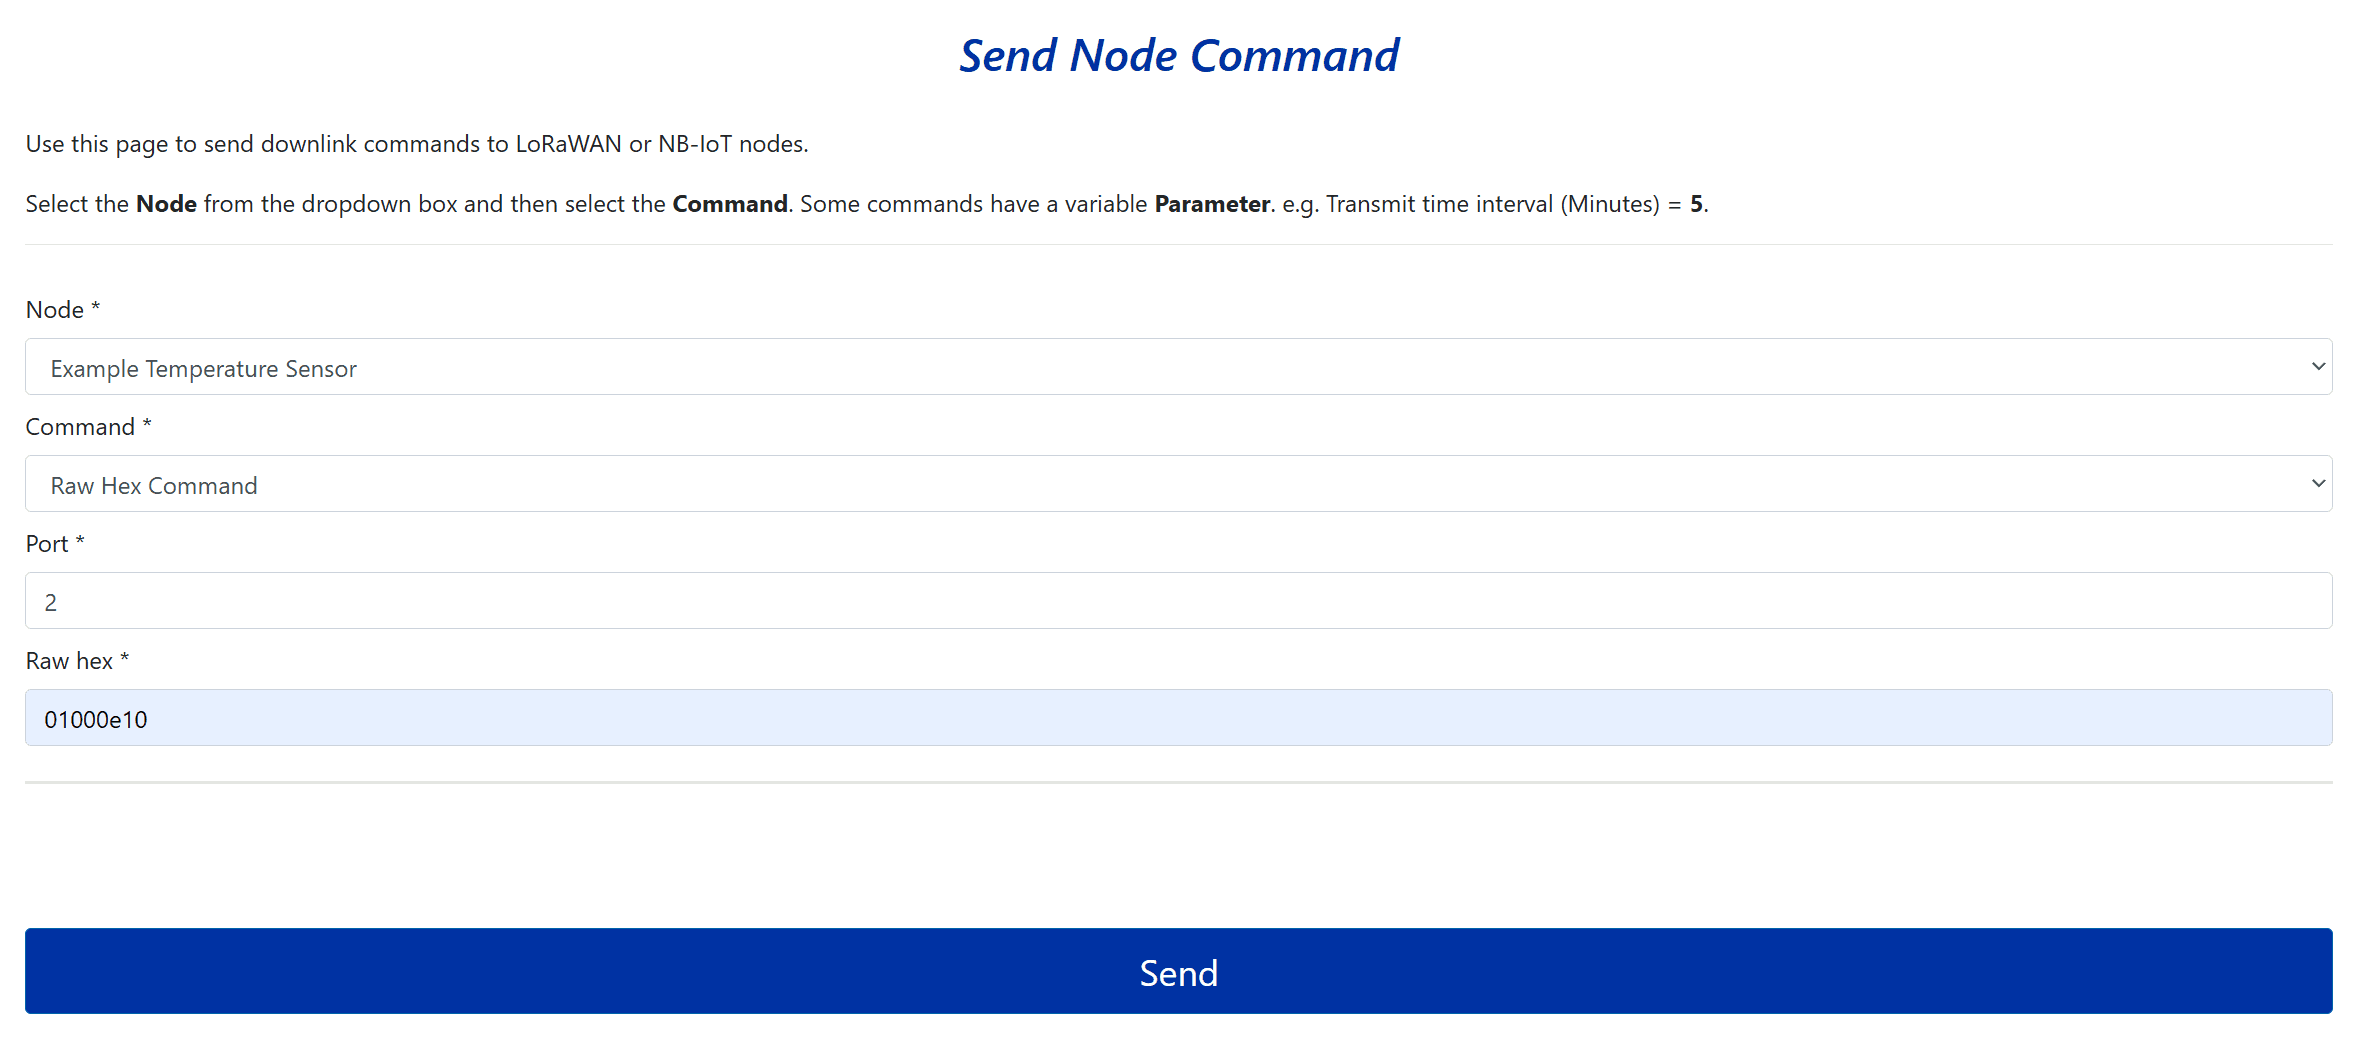
Sending a Raw HEX Command
Select Raw HEX Command from the command list to enter a command not included in the device template. Complete:
- Port: the downlink port required by the device.
- Raw Hex: the hexadecimal payload sent to the device.
Use the device manufacturer’s documentation to confirm the port and command payload.
6.4.4 - Creating Custom Payload Decoders
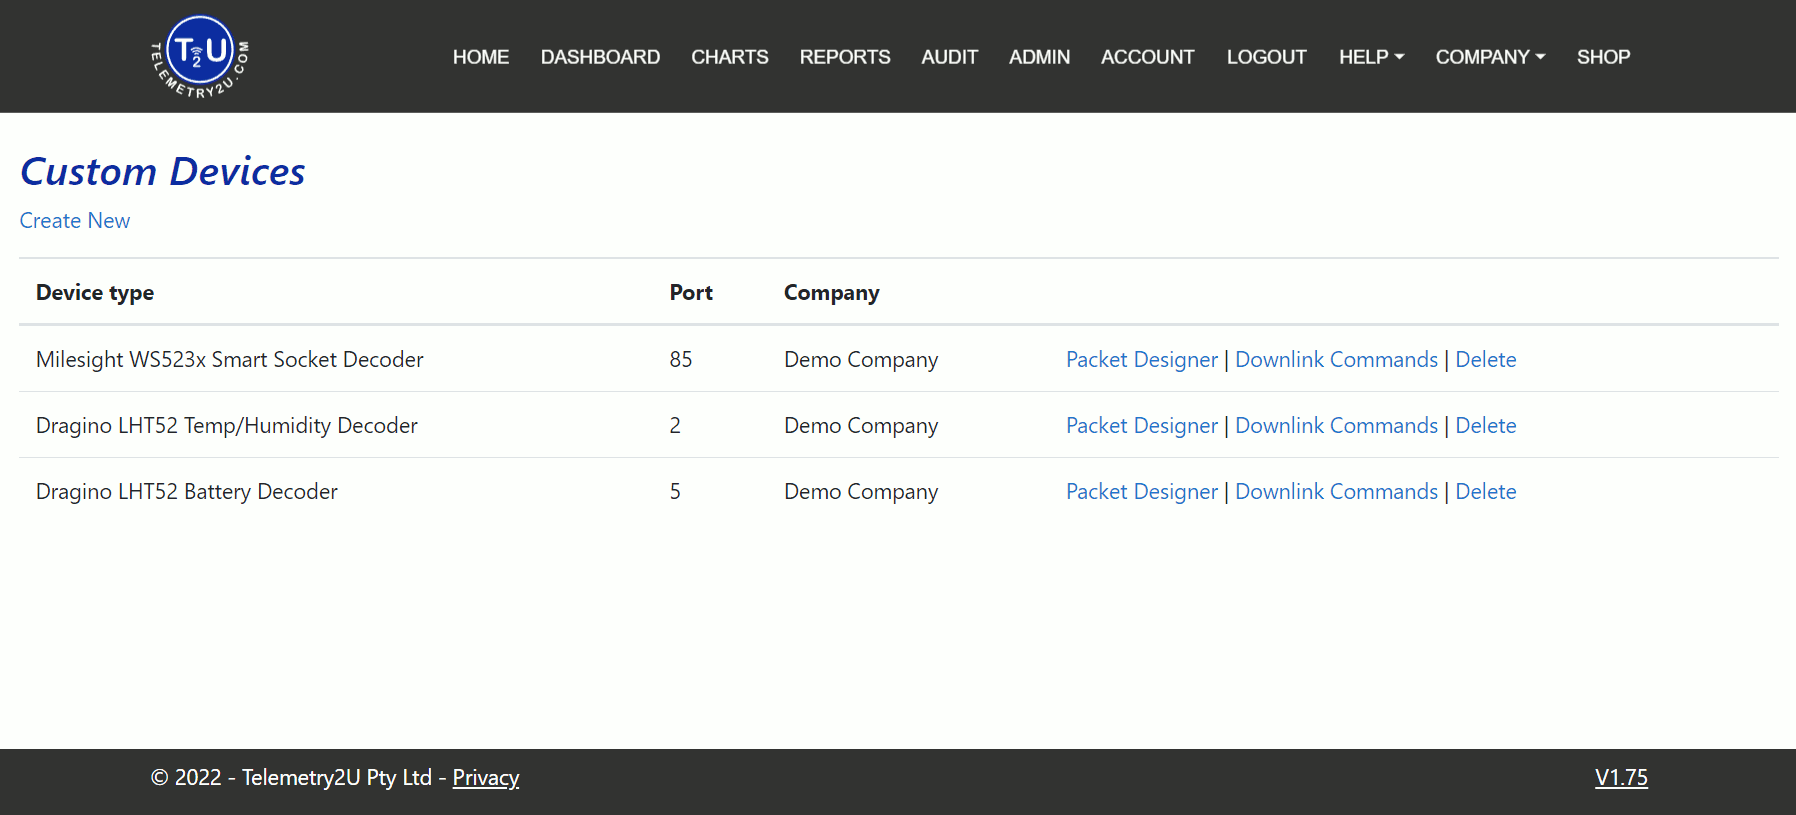
Users with Device Allocation can open Create Custom Device Templates. The Custom Devices index provides:
- Packet Designer: create or edit the payload decoder.
- Downlink Commands: configure commands for the device type.
- Delete: remove the custom device template.
Users with only Node Admin cannot create or edit custom templates.
Device-level decoder settings
- Device Type: unique name shown in device-type lists.
- Port: LoRaWAN uplink port used by this decoder.
- Check Port: process only the specified port when enabled.
- Byte Order: most- or least-significant byte first for multi-byte fields.
- Field Count: number of fields decoded from the packet.
- Next Decoder: optional decoder tried when the current decoder does not match.
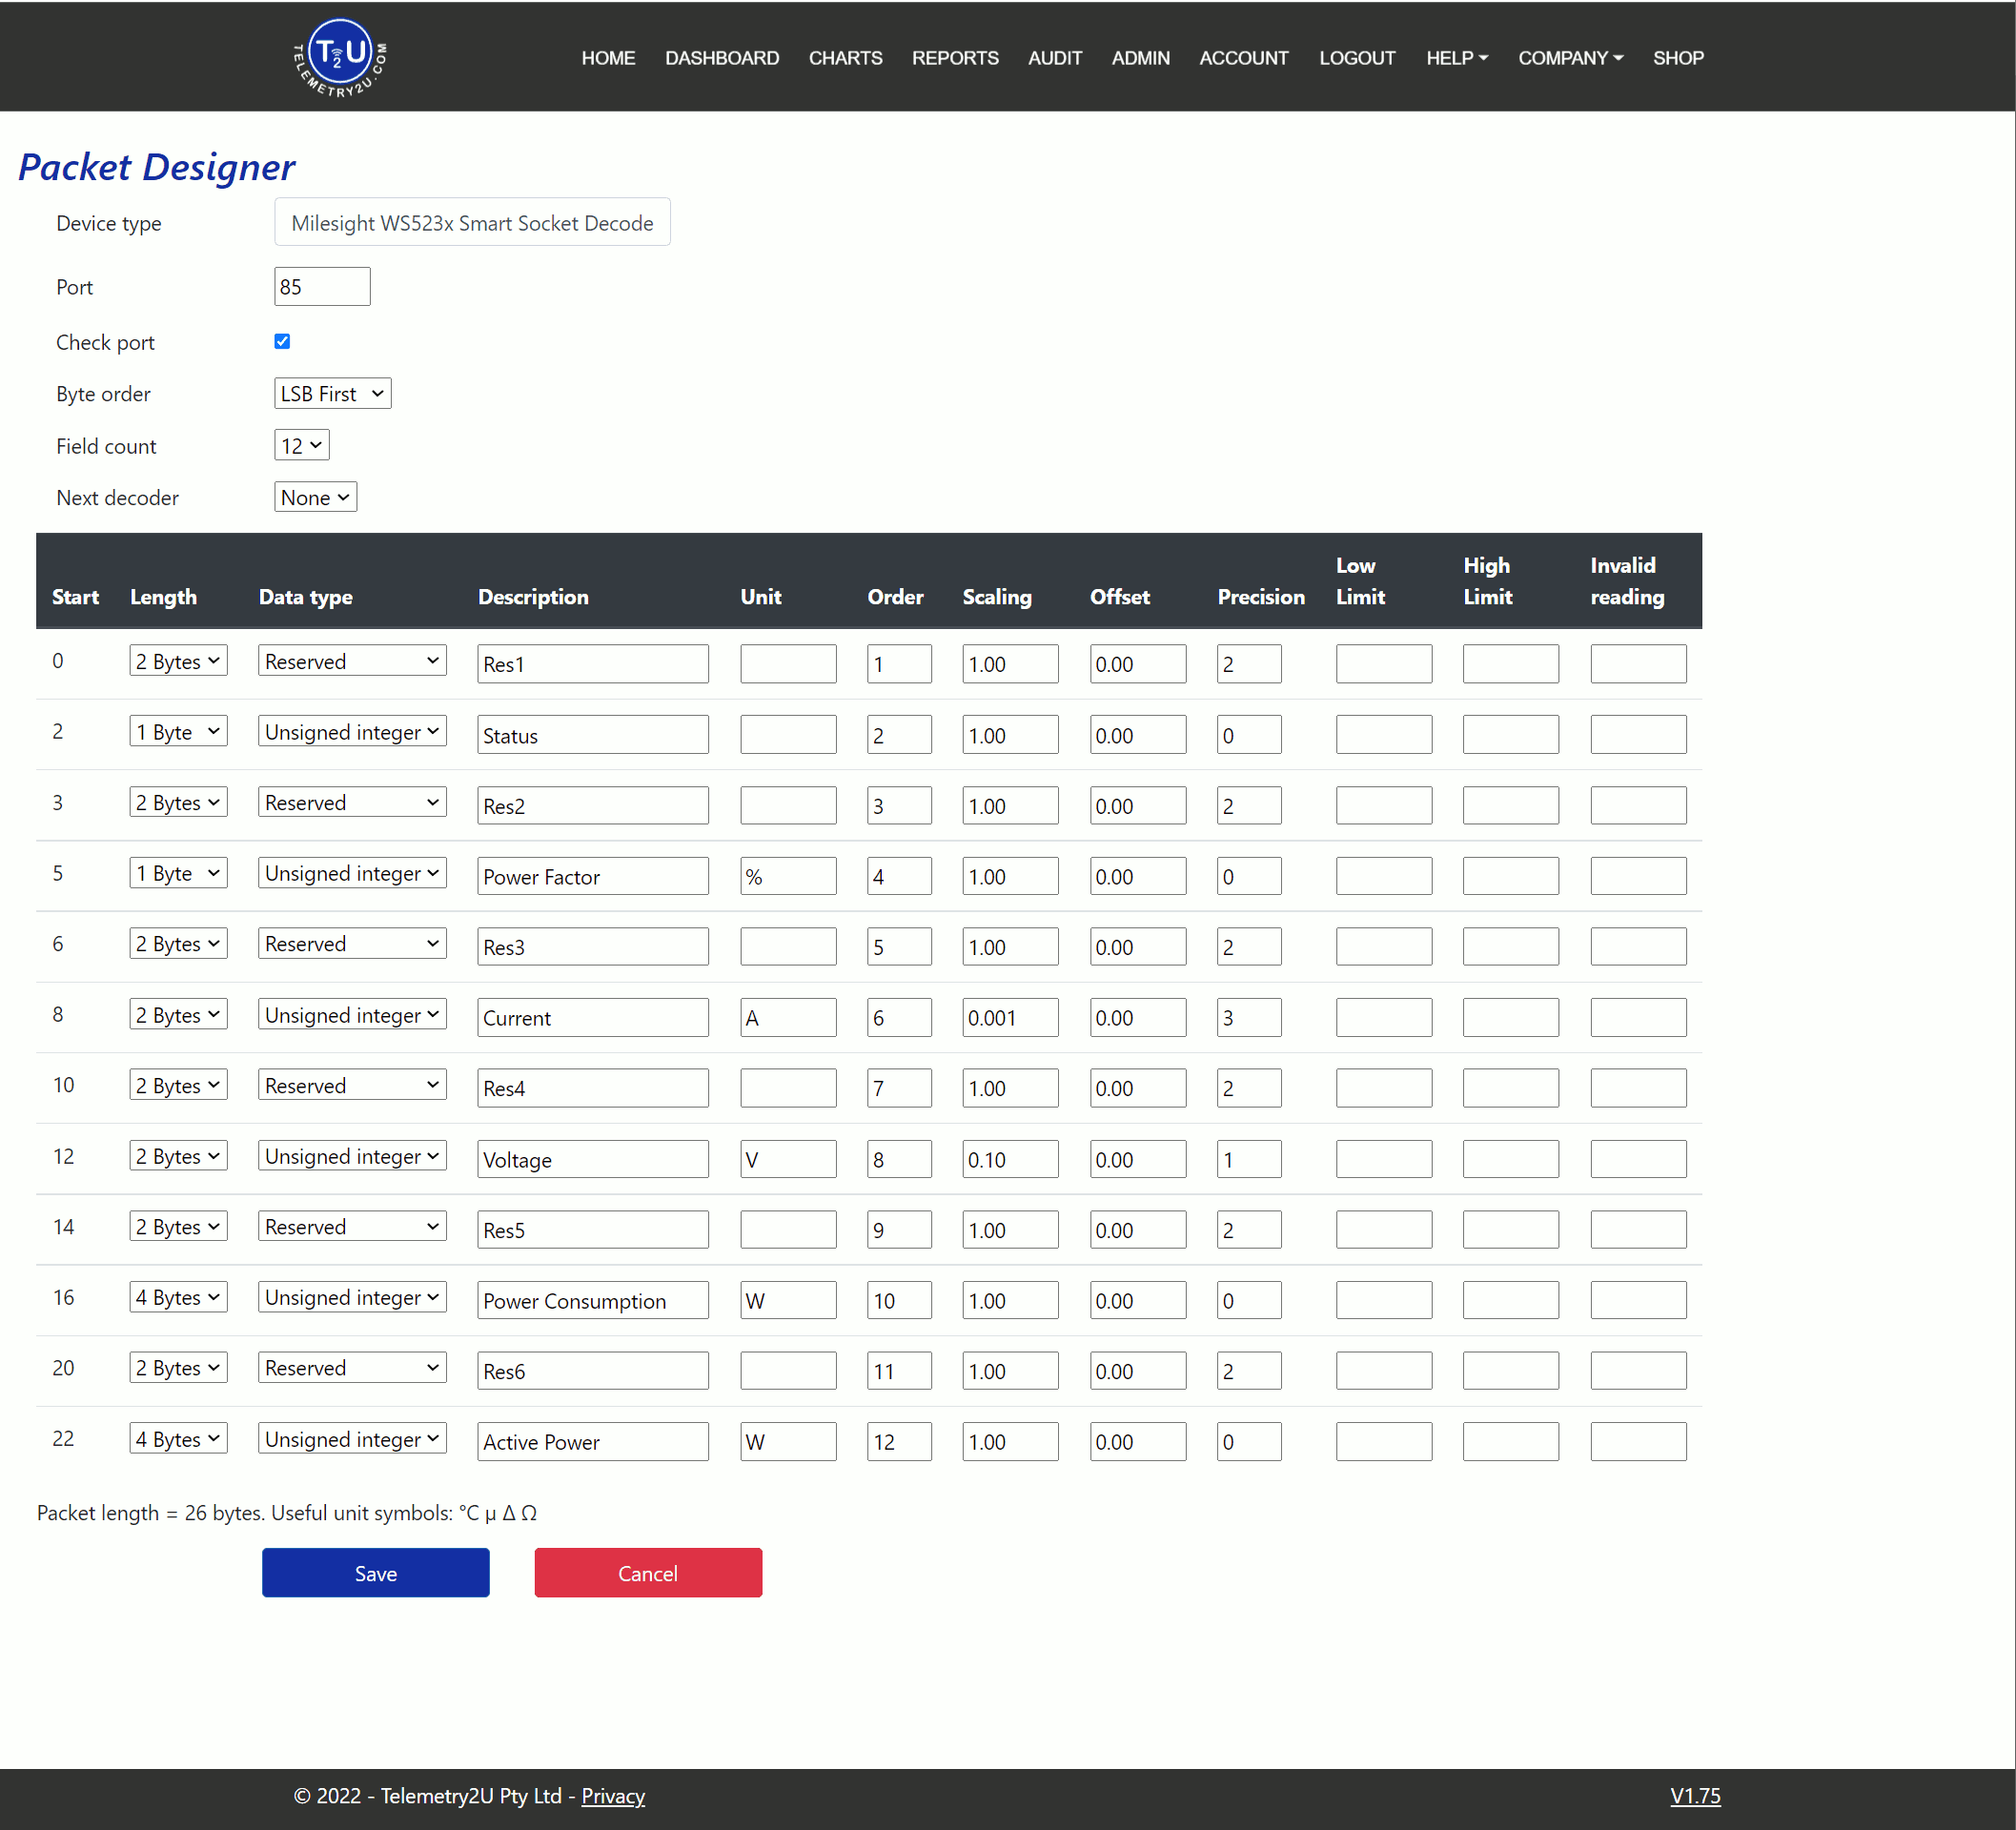
Field settings
- Start: starting byte; the next row advances by the current length.
- Length: number of bytes processed by the field.
- Data Type: unsigned integer, signed integer, floating point, match offset, or reserved. Match offset compares the raw field with the configured offset and rejects or passes the packet to the next decoder when it does not match.
- Description: field name displayed across the platform.
- Unit: displayed unit, including supported Unicode characters.
- Order: field display order in charts and tables.
- Scaling: multiplier applied before the offset using
(Reading × Scaling) + Offset. - Offset: value added after scaling, unless used for a match-offset comparison.
- Precision: number of displayed decimal places.
- Low Limit: optional minimum displayed value.
- High Limit: optional maximum displayed value.
- Invalid Reading: raw value treated as an invalid sensor state and available for alerting, such as
65535for some disconnected probes.
Select Save to apply the decoder. It then appears as a Device Type when creating or editing a node.
See the custom payload decoder examples for worked packet layouts and field settings.
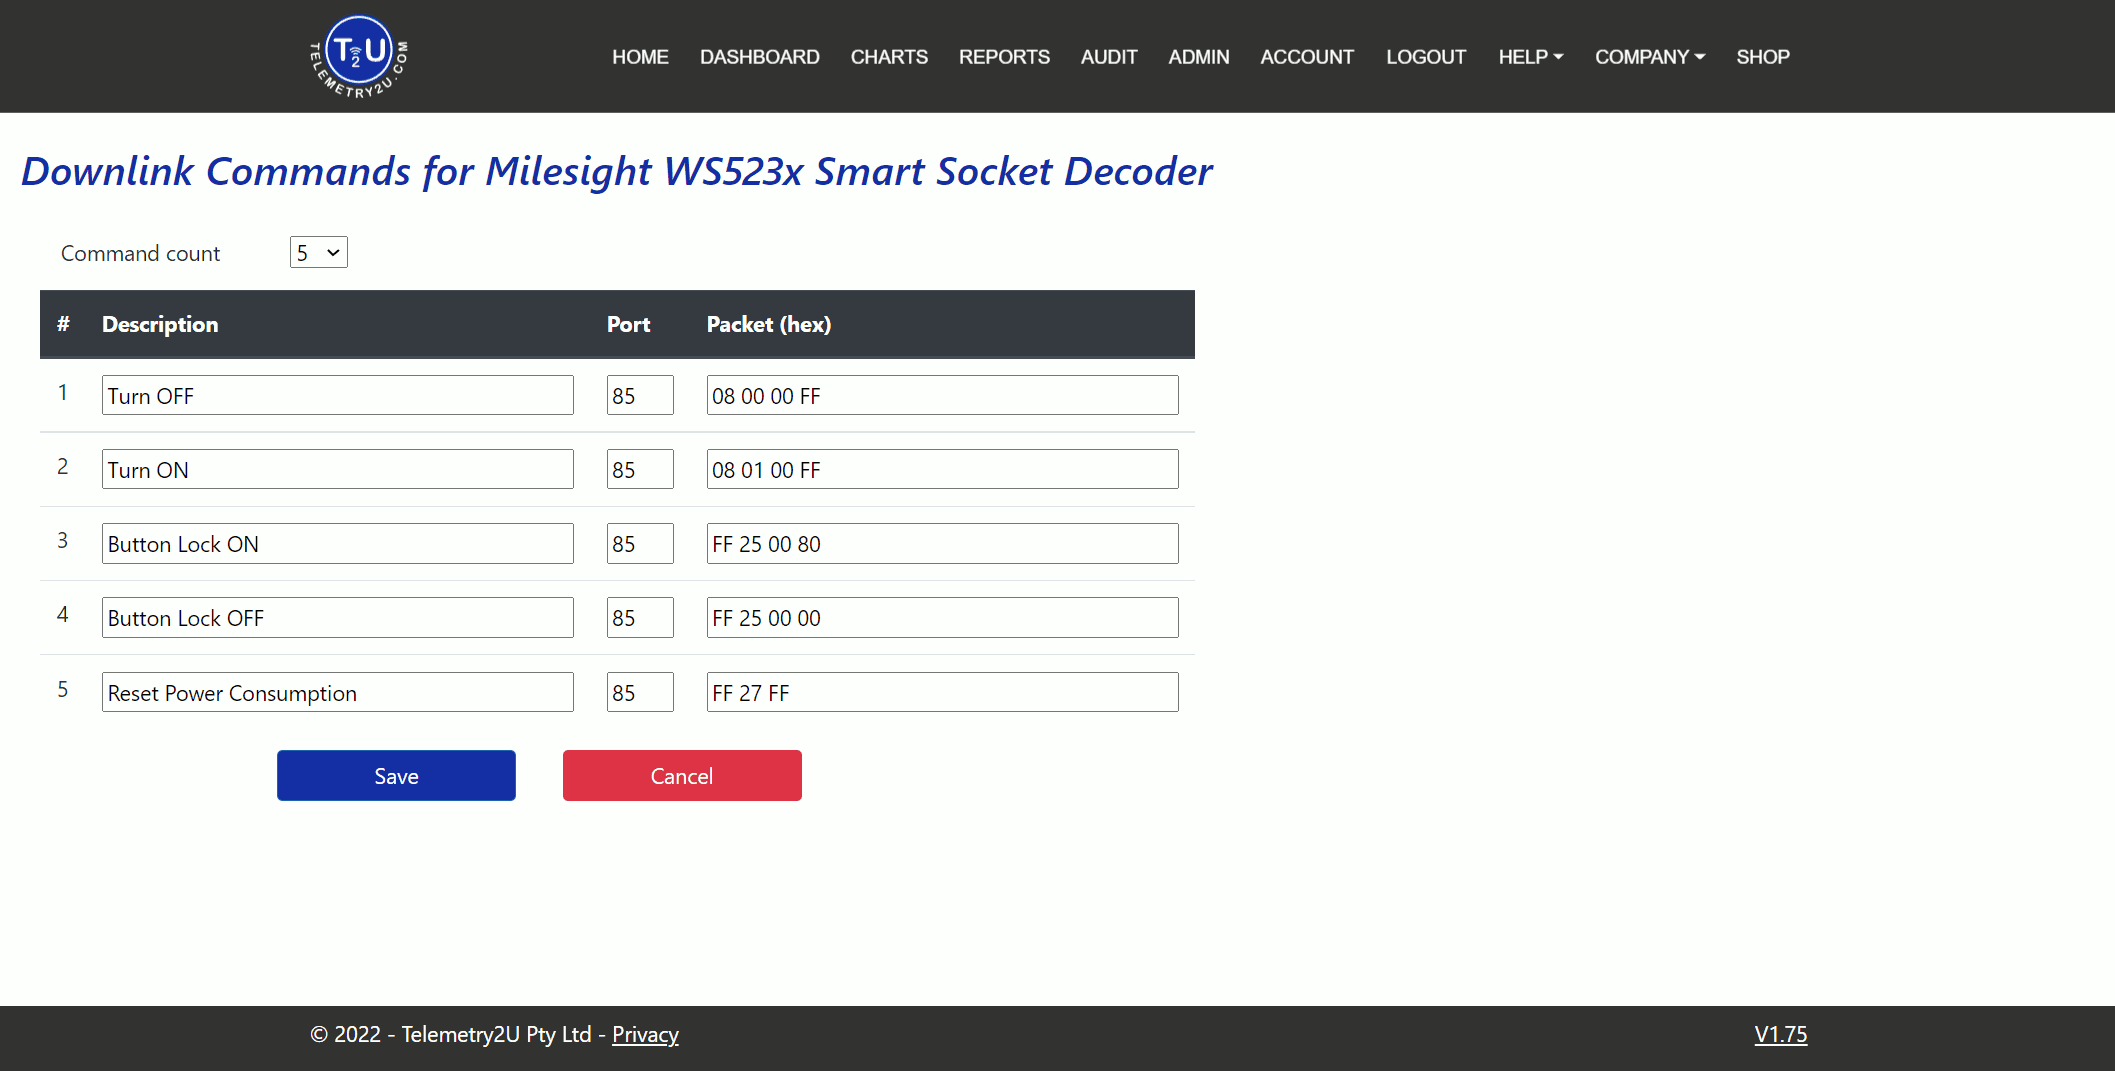
6.4.5 - Creating Custom Downlink Commands
From the Custom Devices index, select Downlink Commands beside a template. Choose a Command Count to create up to 20 command rows, then complete:
- Description: command name displayed in command lists.
- Port: downlink port used by the command.
- Packet (hex): raw hexadecimal payload defined by the device protocol.
Select Save after completing the command list.
Saved commands become available on the Send Downlink Command page and can also be used by dashboard buttons and action groups.
6.5 - Gateway Admin
Add private LoRaWAN gateways, configure gateway-down notifications, and review connection status.
Users with Gateway Admin can open Add / Edit LoRaWAN Gateways. Before adding a gateway, configure its server address and packet-forwarder port for the selected frequency plan. These values vary by deployment and frequency region; use the settings supplied by the platform or the gateway network configuration guide.
The Gateway index lists gateways linked to the account. Use Edit or Delete beside a row, or select Add a New Gateway. The create and edit forms contain the same settings.
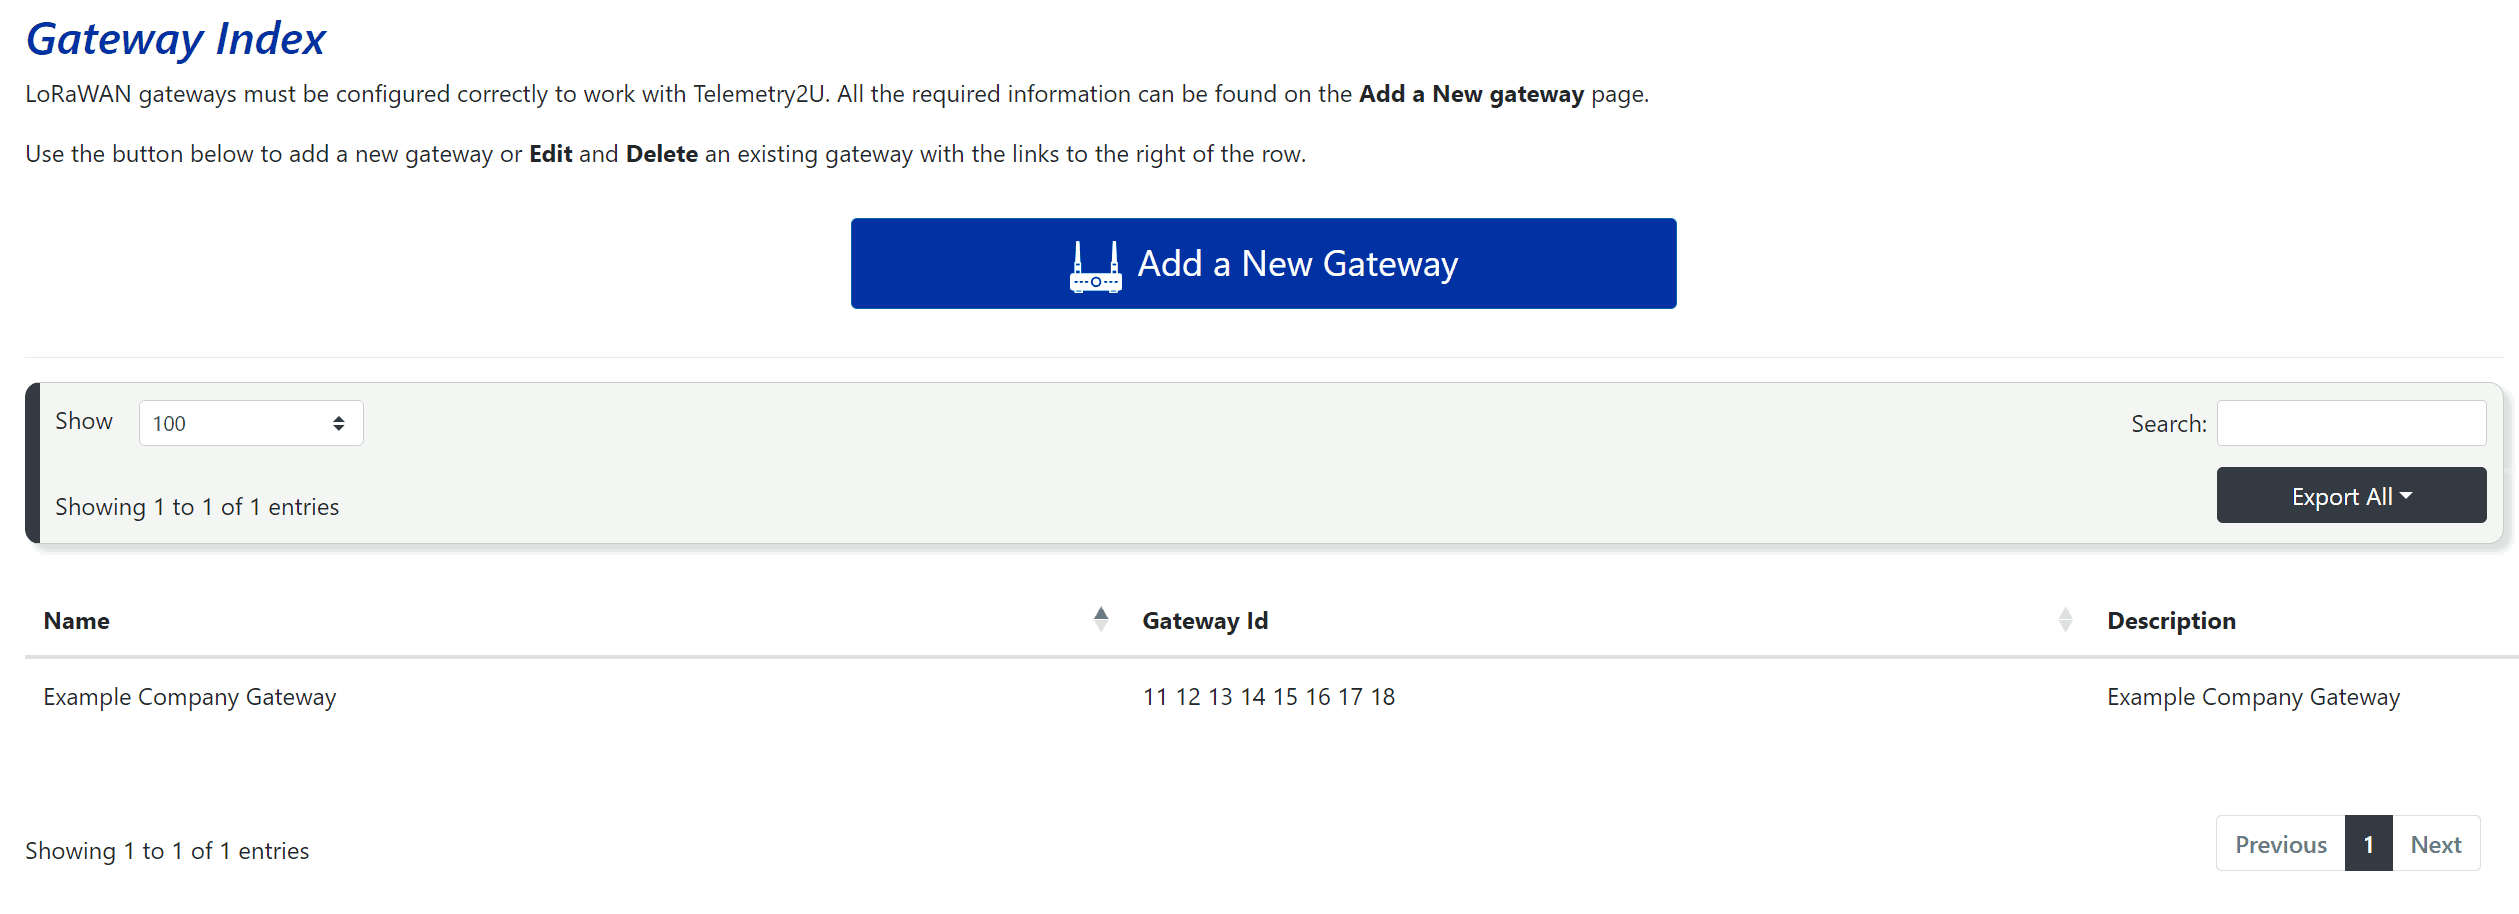
6.5.1 - Creating and Editing Gateways
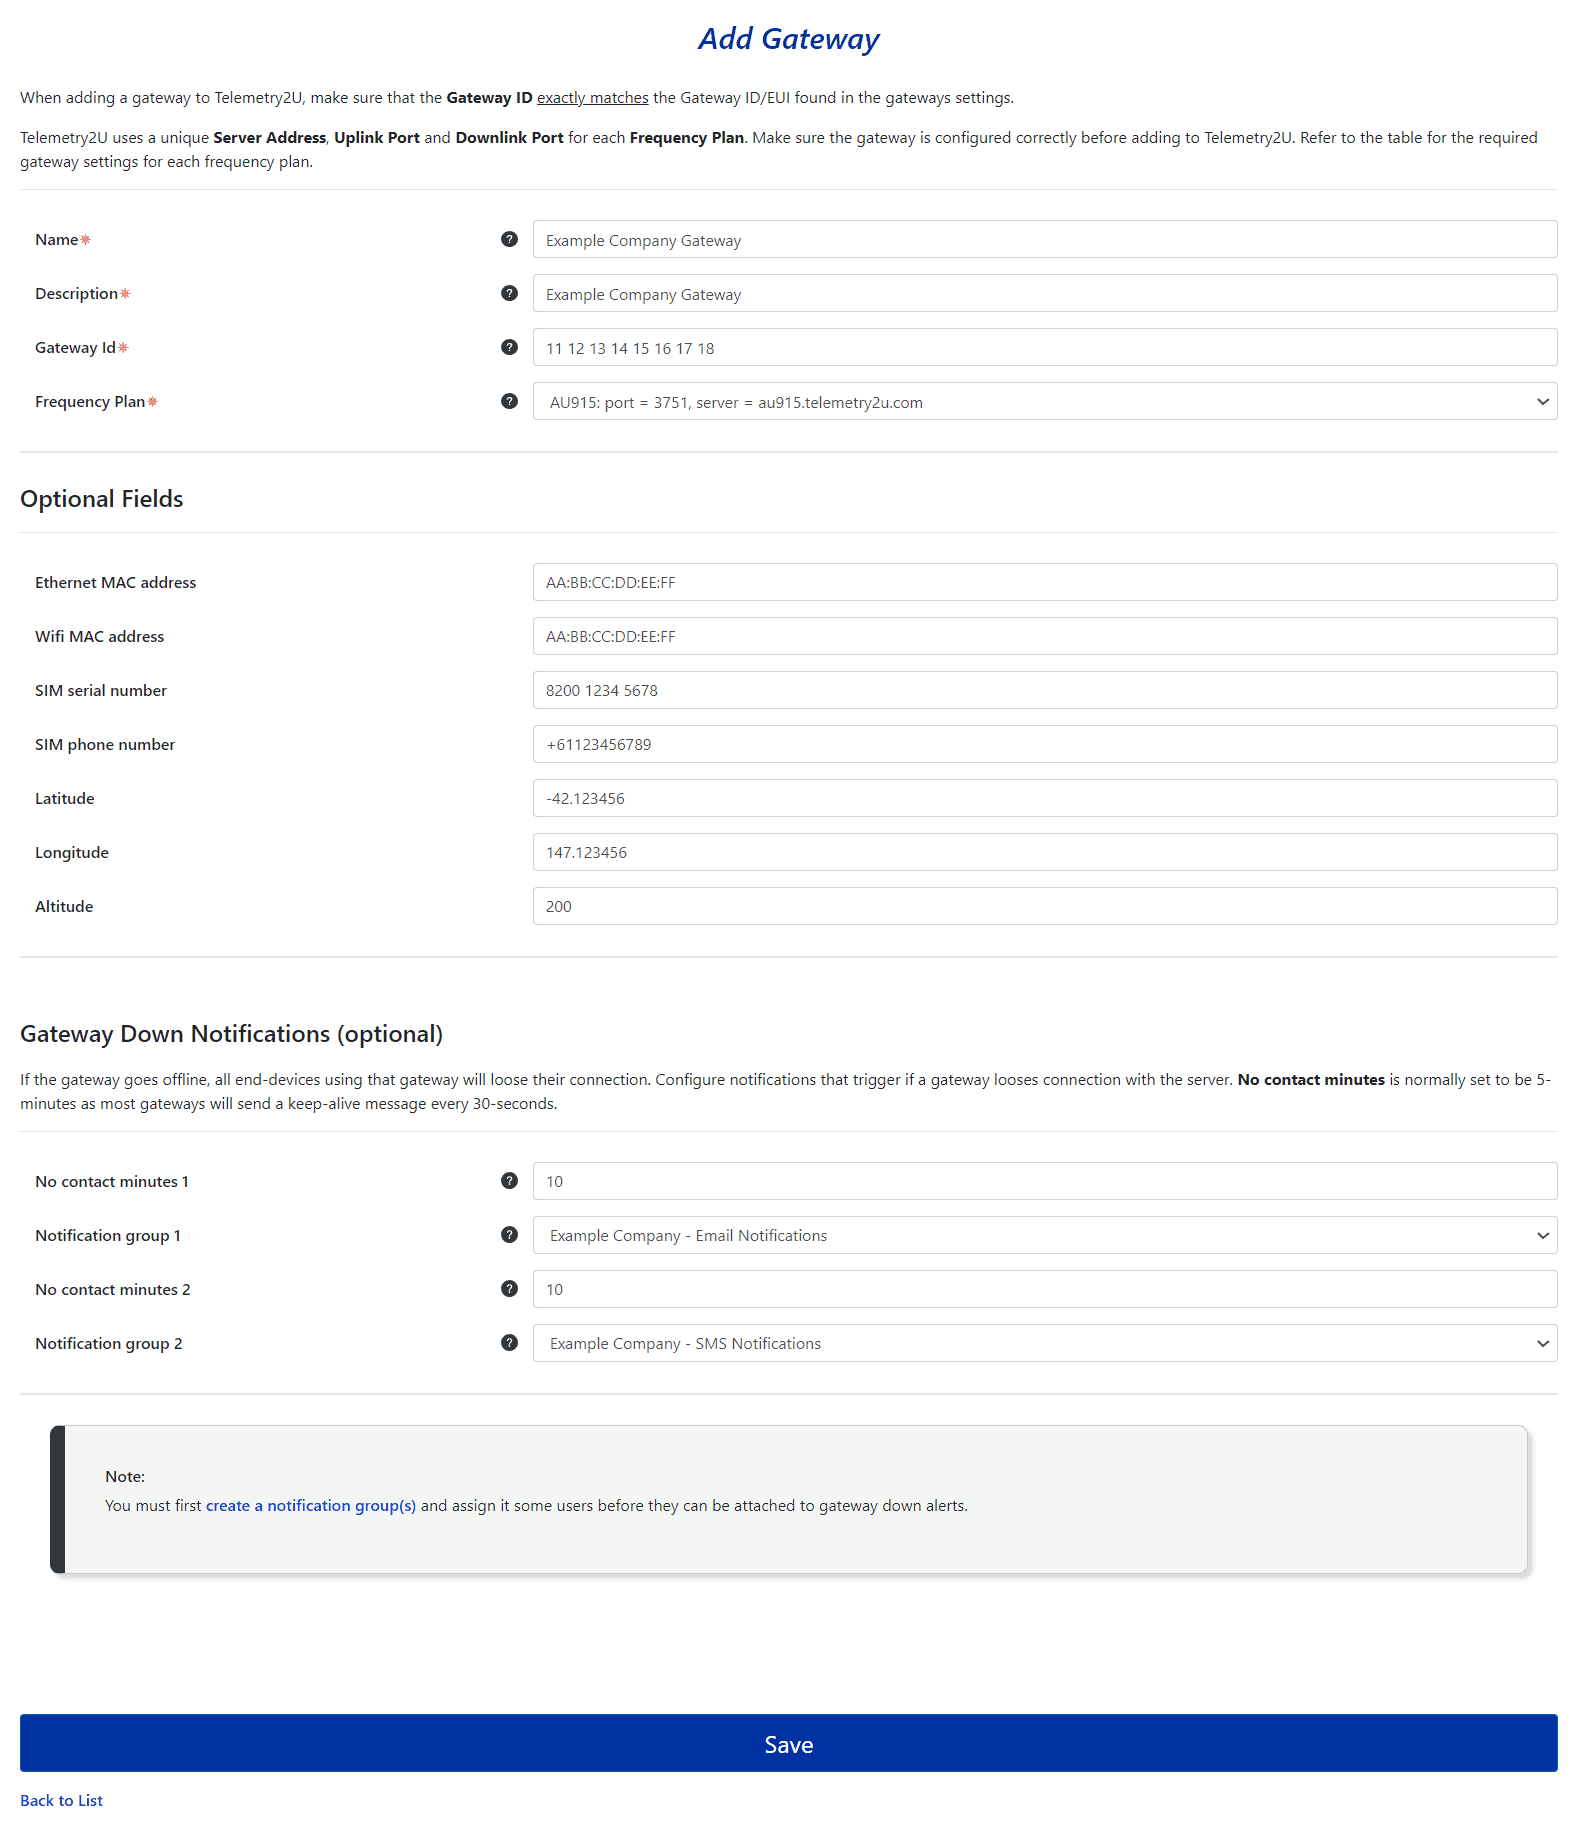
1. Gateway Details
- Name: gateway name shown across the platform.
- Description: additional identifying information.
- Gateway ID: unique 16-character gateway EUI from the gateway settings.
- Frequency Plan: plan configured on the gateway; it must match the server and port settings.
2. Gateway Down Notifications
- No Contact Minutes: time without contact before the rule triggers.
- Notification Group: group notified when the no-contact time is reached.
Two notification groups can be configured independently. A recovery message is sent when the gateway reconnects.
3. Optional Fields
Store additional gateway information such as Ethernet and Wi-Fi MAC addresses. Recording these values during commissioning can simplify later remote support.
Select Save after completing the form.
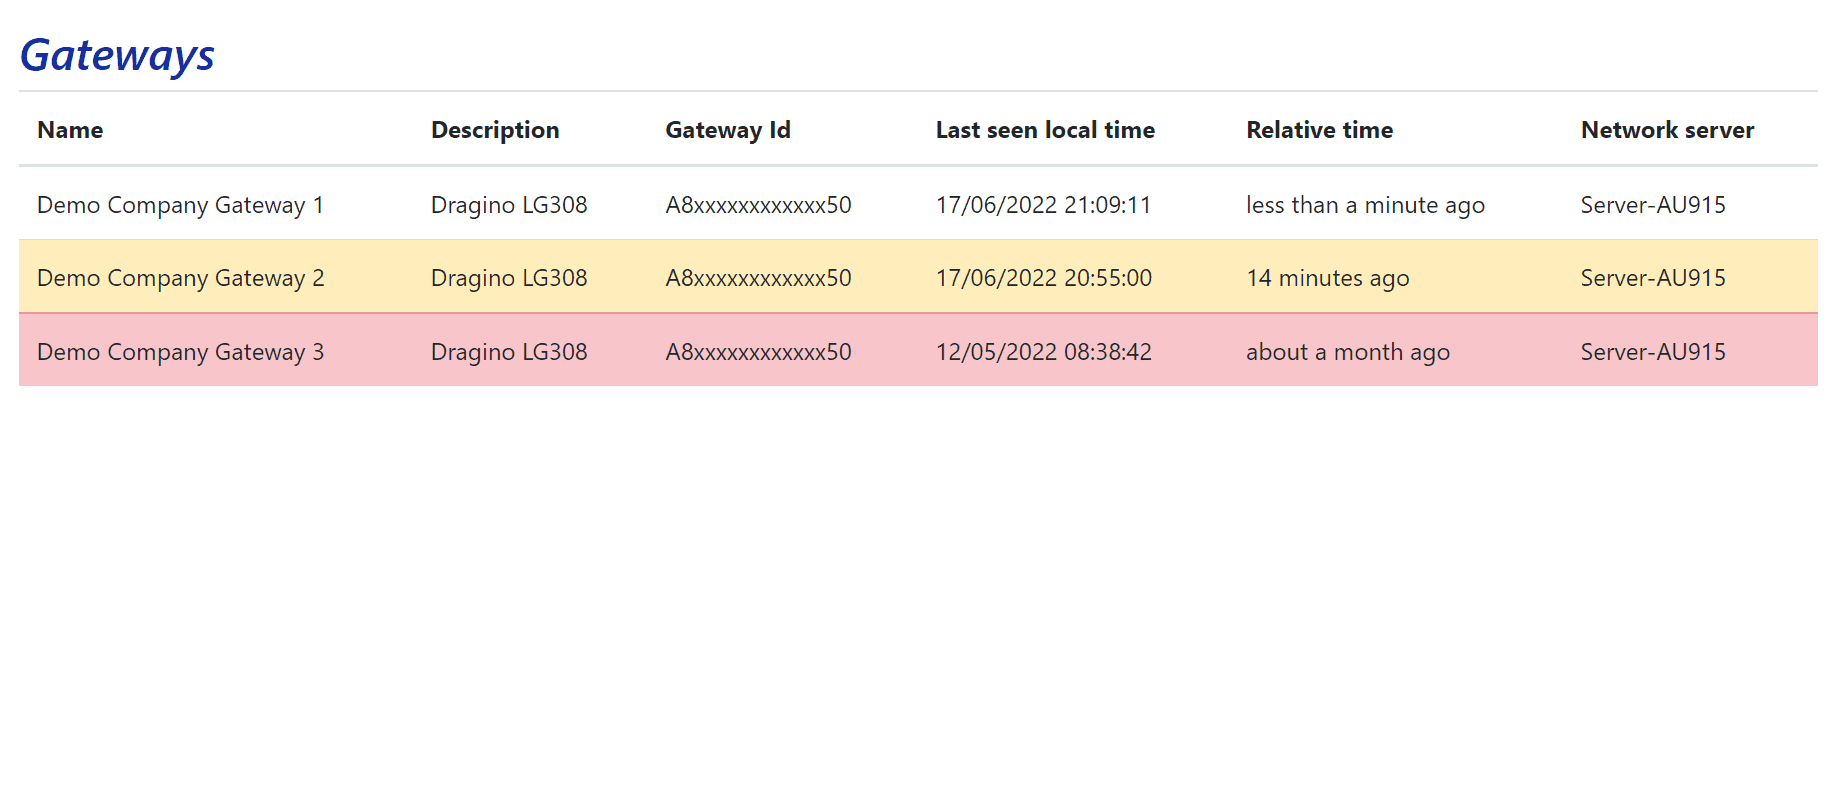
6.5.2 - Gateway Status
Users with View Gateway Status can open the Gateway Status page without permission to edit gateway settings. The table shows when each gateway last contacted the server.
Gateway seen within the last 10 minutes.
Gateway not seen for at least 10 minutes.
Gateway not seen for more than one hour.
Most packet-forwarder gateways send a keep-alive approximately every 30 seconds, so a healthy gateway normally shows a recent relative time.
6.6 - Calibrations
Apply two-point, three-point, or offset corrections to sensor inputs and store calibration certificates with their nodes.
The latest calibration affects records from 00:00 on the date it is applied. Earlier historical data remains unchanged, preserving the record of previous sensor behaviour.
6.6.1 - Entering and Editing Calibrations
Open Calibrate End Devices, select a node, and configure the relevant input in the calibration table:
- Input: sensor input to calibrate.
- Units: read-only input units.
- Calibration Type: two-point or three-point calibration.
- Uncalibrated Readings: comma-separated raw sensor values.
- Calibrated Readings: comma-separated reference values.
- Offset: additional offset applied with the calibration.
- Current Uncalibrated: latest value without calibration.
- Current Calibrated: latest value with calibration applied.
Calibrated by initially uses the signed-in email address but can be changed. Enter the required Notes, then select Save.
If an input is missing, confirm that it is not hidden in Section 6.4.2.
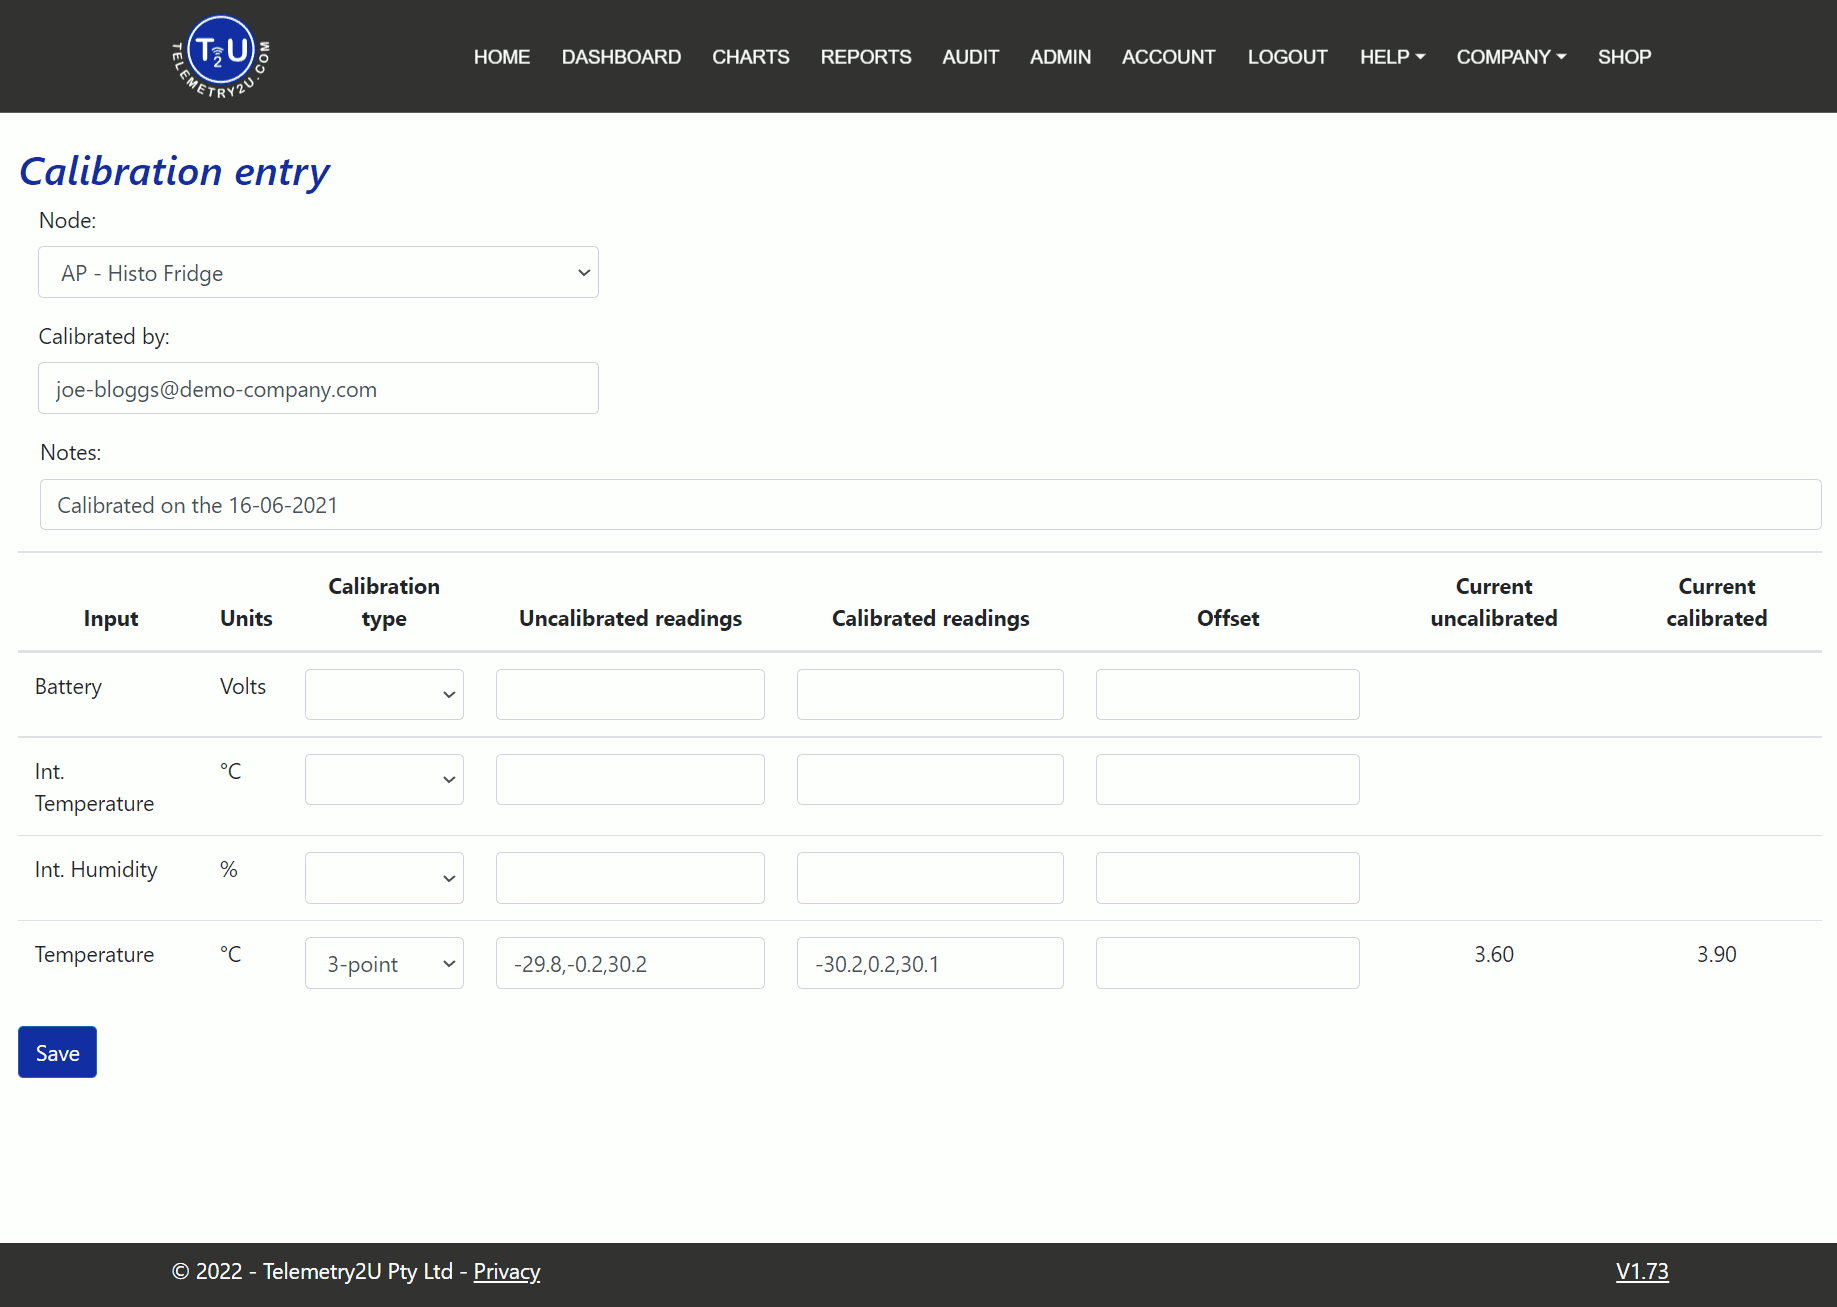
A temperature sensor measured -29.8, -0.2, 30.2 while the reference
instrument measured -30.2, 0.2, 30.1. Enter the sensor readings as the
uncalibrated values and the reference readings as the calibrated values. The current
values provide an immediate check of the resulting correction.
To apply only an offset, choose two-point calibration, enter 0,1 in both
reading fields, enter the required offset, and save.
For a complete temperature-sensor workflow, see the NATA facility calibration instructions.
6.6.2 - Uploading Calibration Certificates
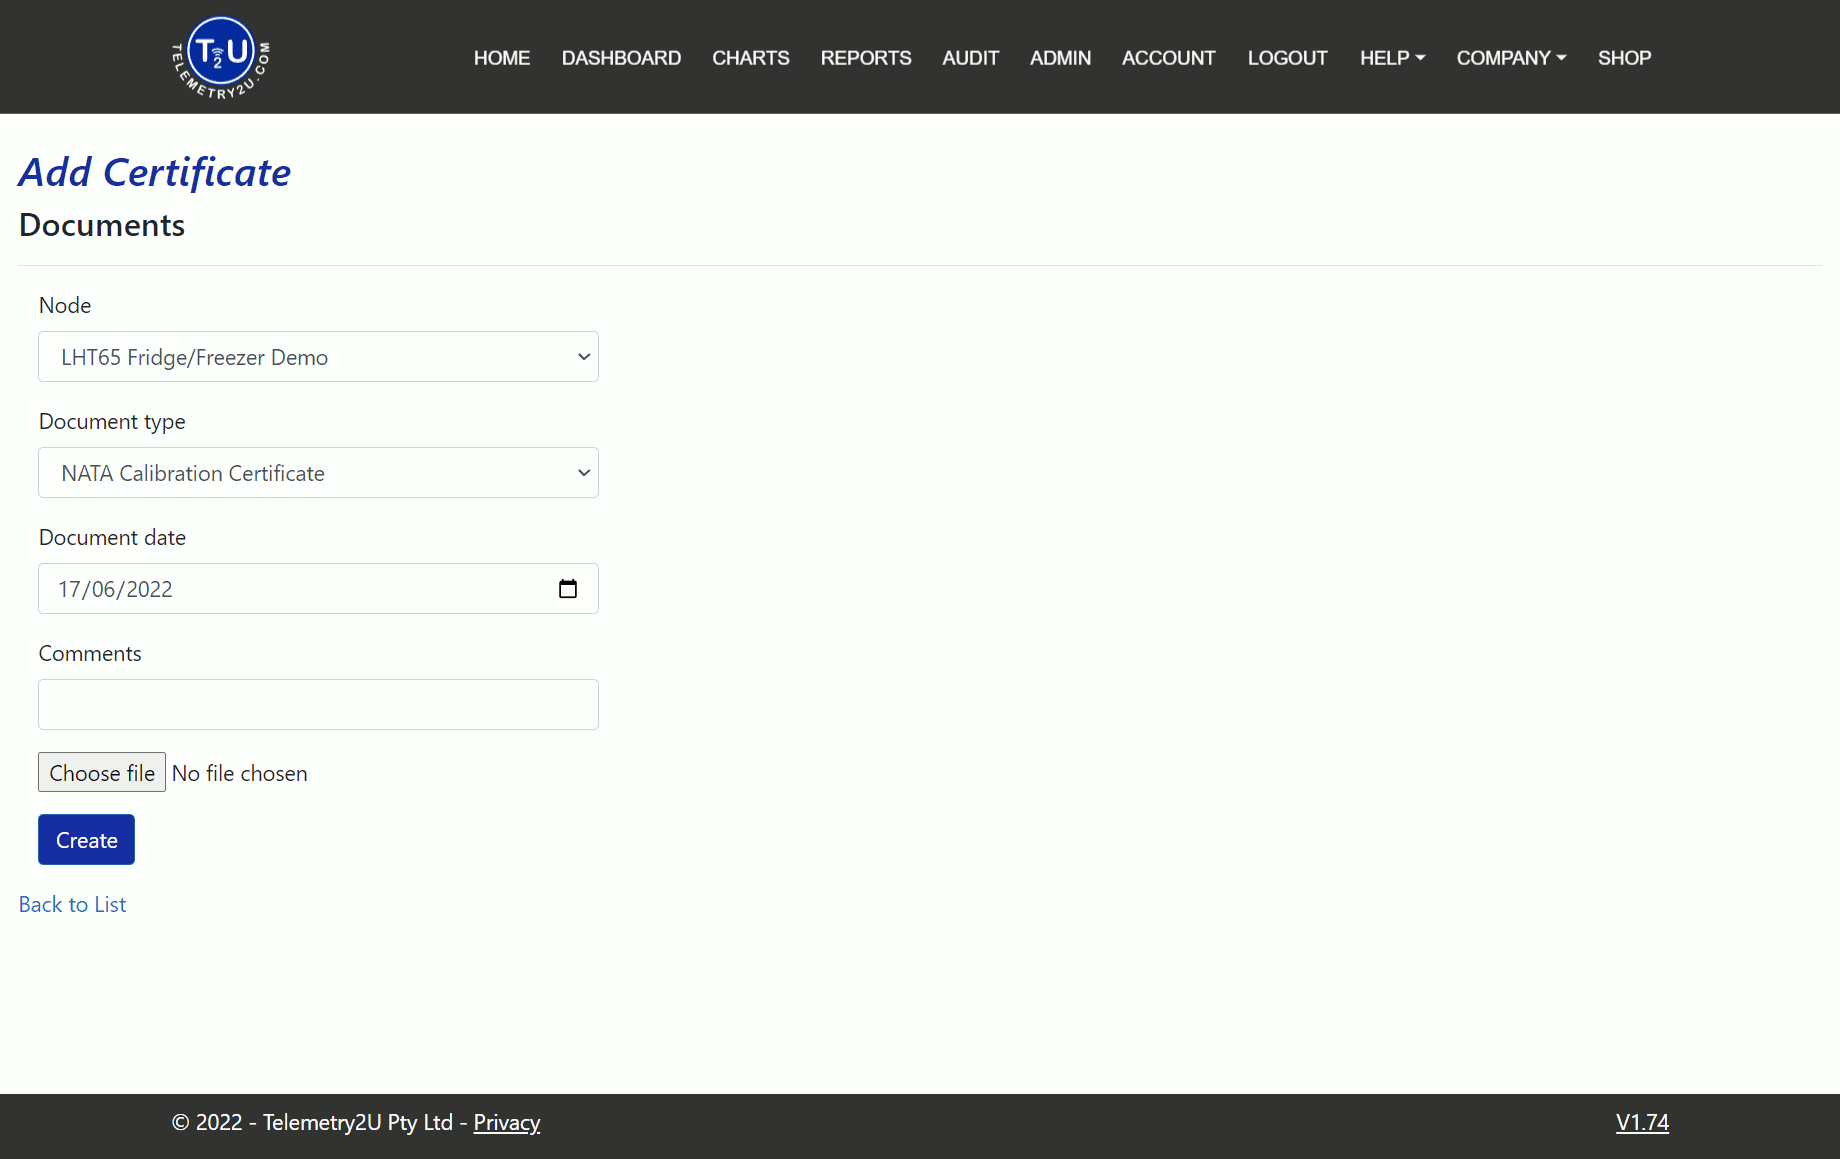
Open Upload Calibration Certificate, select Create New, and complete:
- Node: node associated with the certificate.
- Document Type: category of the uploaded document.
- Document Date: certificate or calibration date.
- Comments: optional notes.
- Choose File: PDF certificate selected from the local device.
Users with View Documents can download certificates but cannot upload or edit them without the Calibration role.
6.6.3 - Downloading Calibration Certificates
Open the Documents Index and select View beside a node, or use Expand All +. An expanded record can show:
- Document Date: date associated with the certificate.
- Comments: notes entered when it was uploaded.
- Description: calibration or document description.
- View: PDF icon used to open or download the certificate.
- Edit: change the document record.
- Delete: remove the certificate.
View Documents permits viewing and downloading only. Calibration permits the full document-management workflow.

6.7 - Actions and Automation
Combine one or more downlink commands into an action group, then run it from a schedule or sensor alert condition.
Users with Actions Admin can open Add / Edit Actions and Triggers and Create Action Schedule.
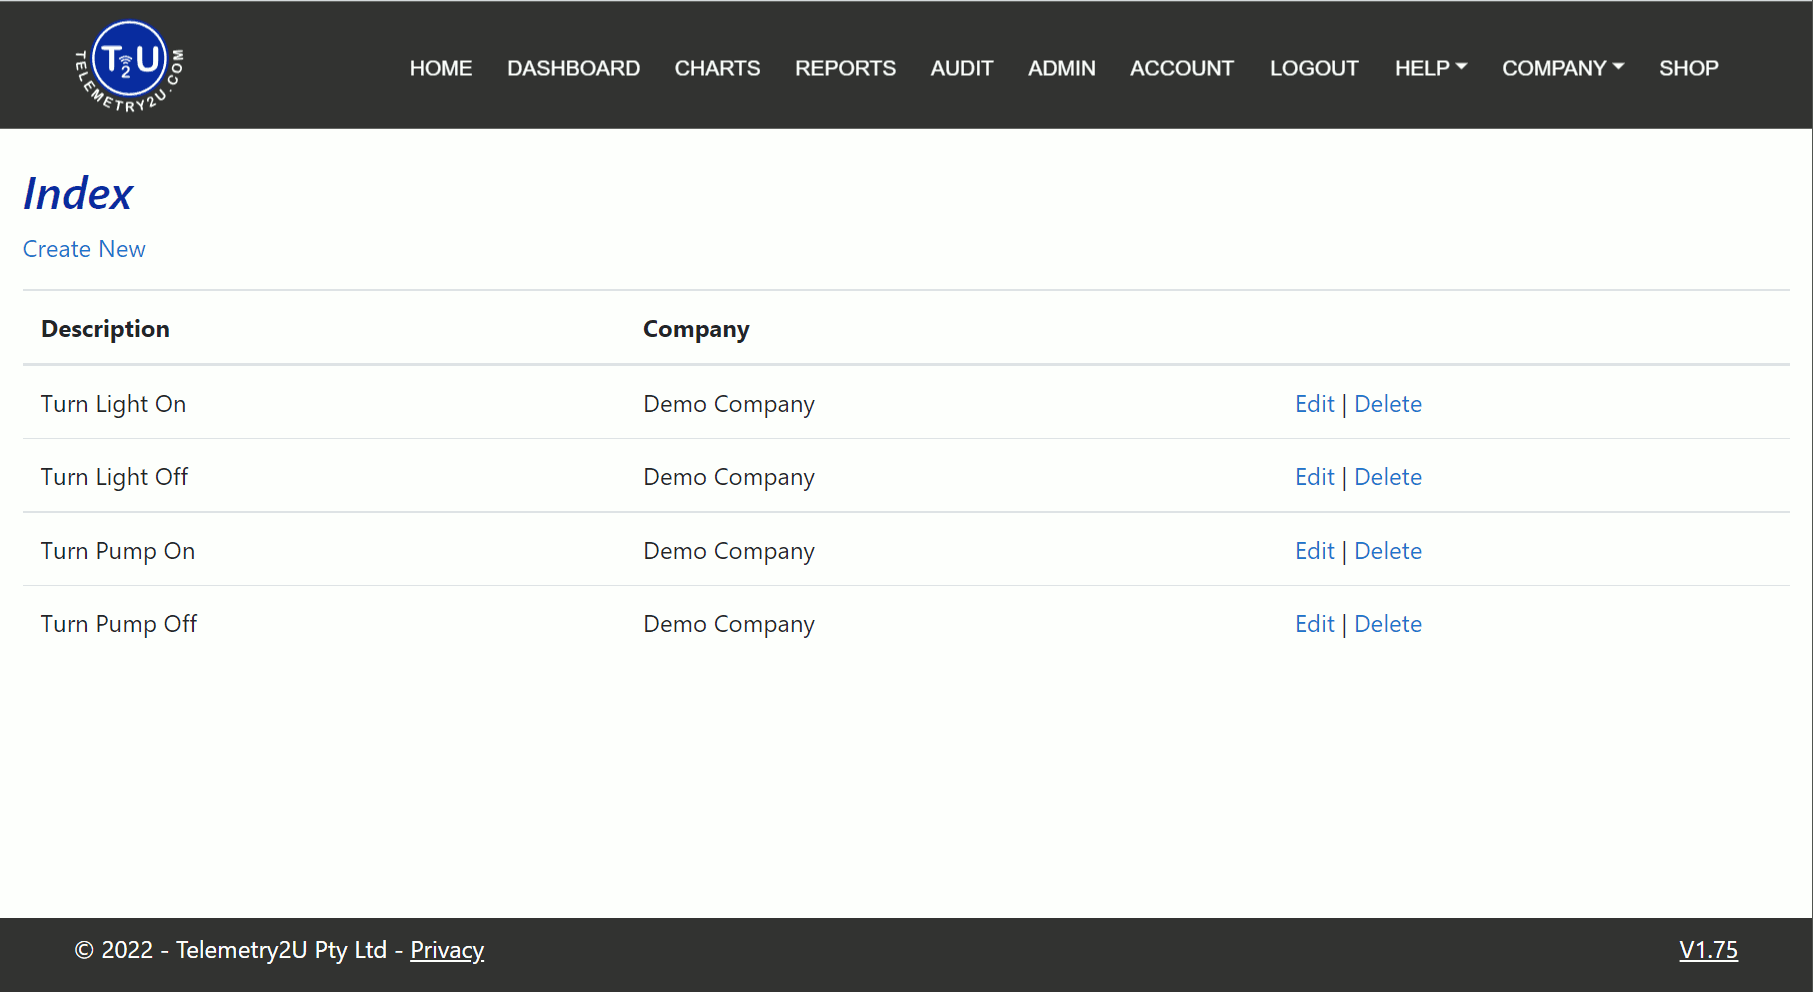
The Action Index lists configured action groups. Use Edit or Delete beside a row, or select Create New Action Group.
6.7.1 - Creating and Editing Actions
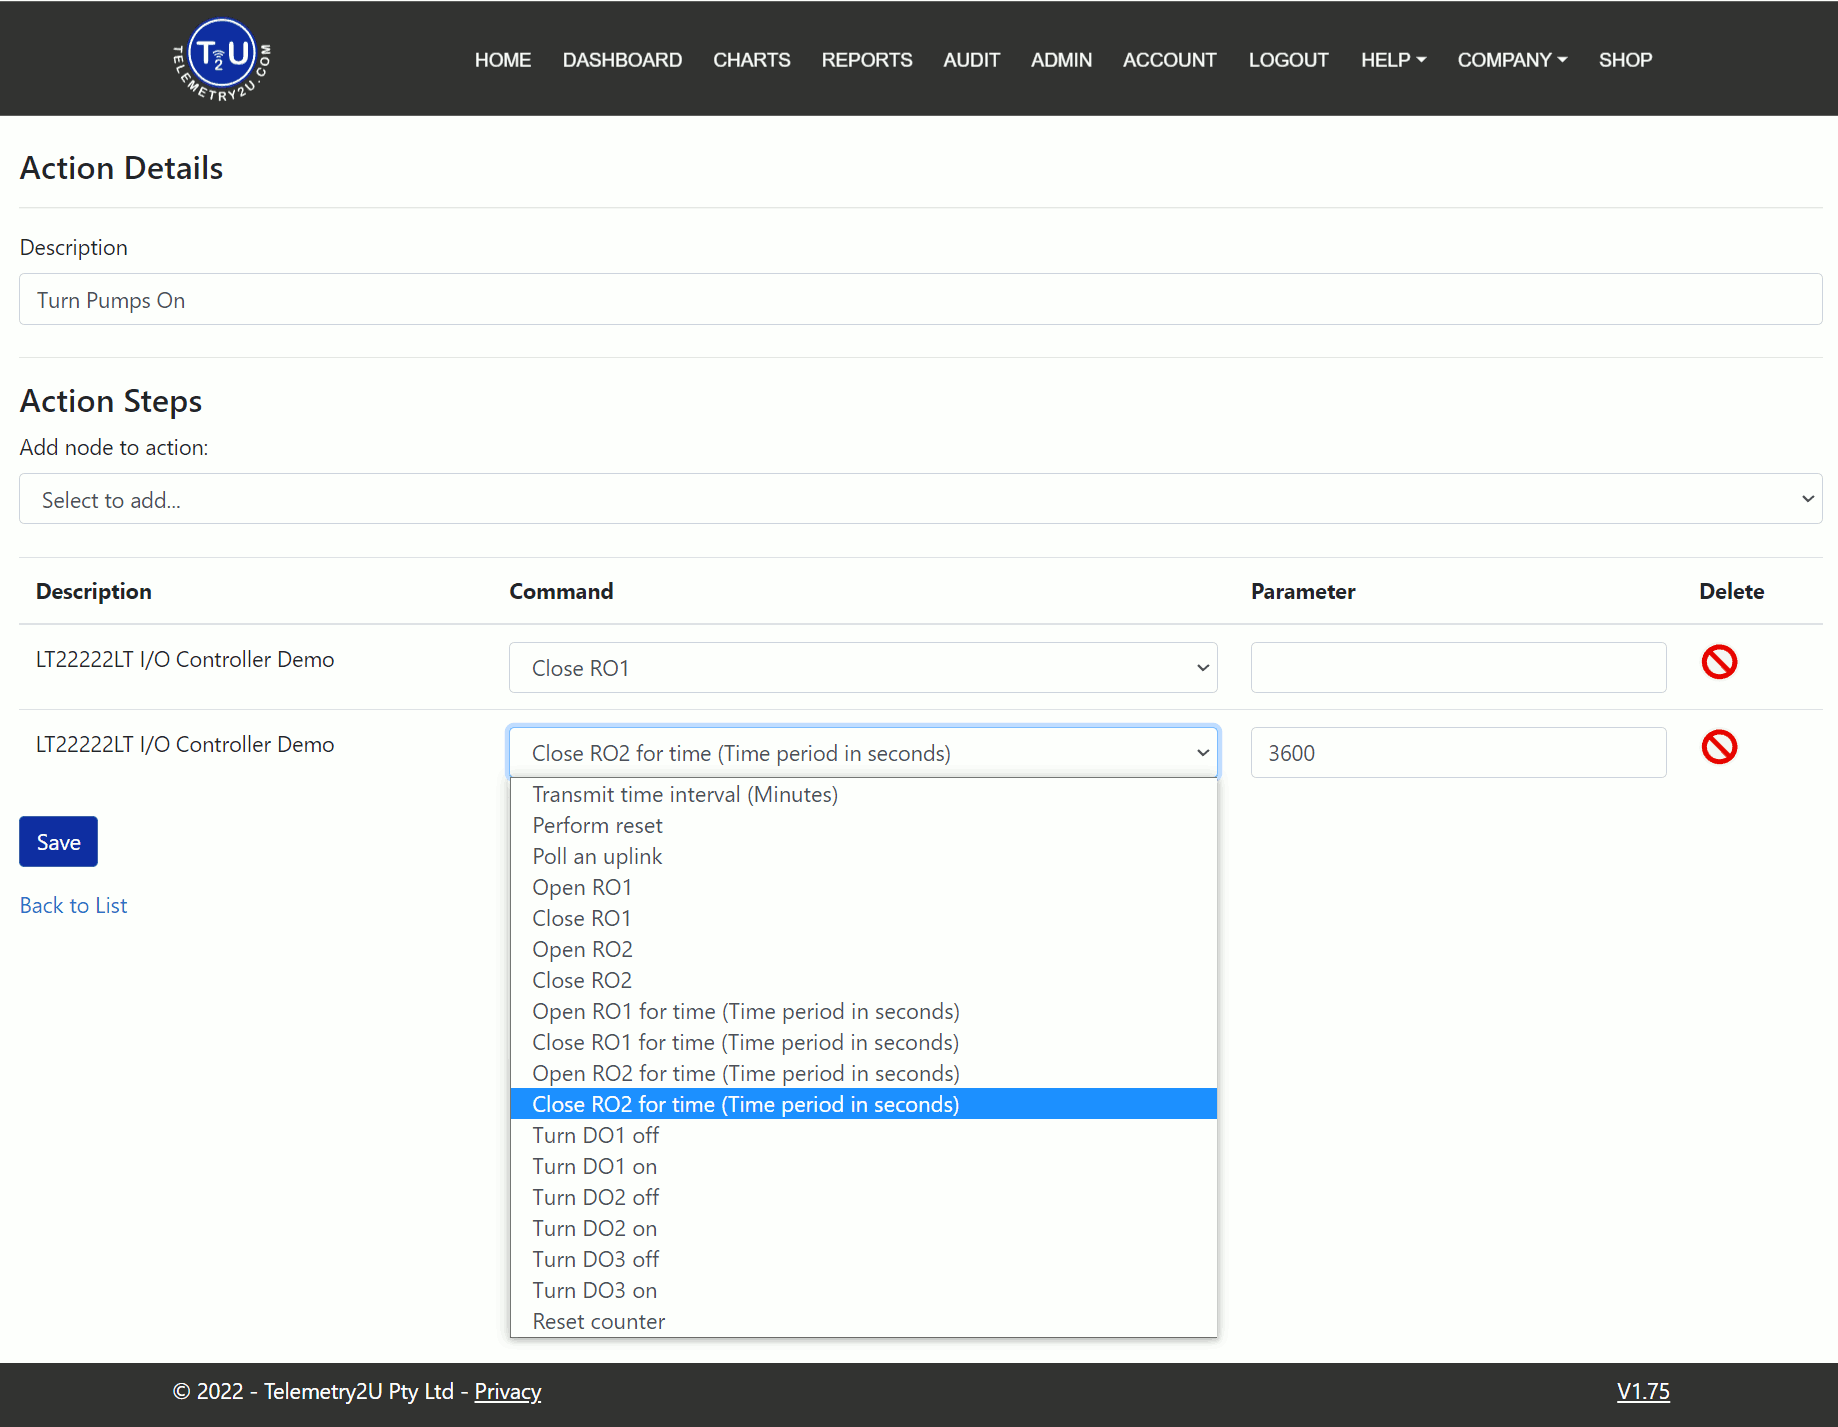
Complete the action-group form:
- Description: unique action-group name.
- Add Node to Action: node added to the command table.
- Command: device command included in the action step.
- Parameter: optional value required by the command.
- Delete: removes the command step.
Add as many steps as required. They are queued in order when the action runs. Class A commands are received after the relevant device’s next uplink.
Select Save after completing the steps.
6.7.2 - Scheduling Actions
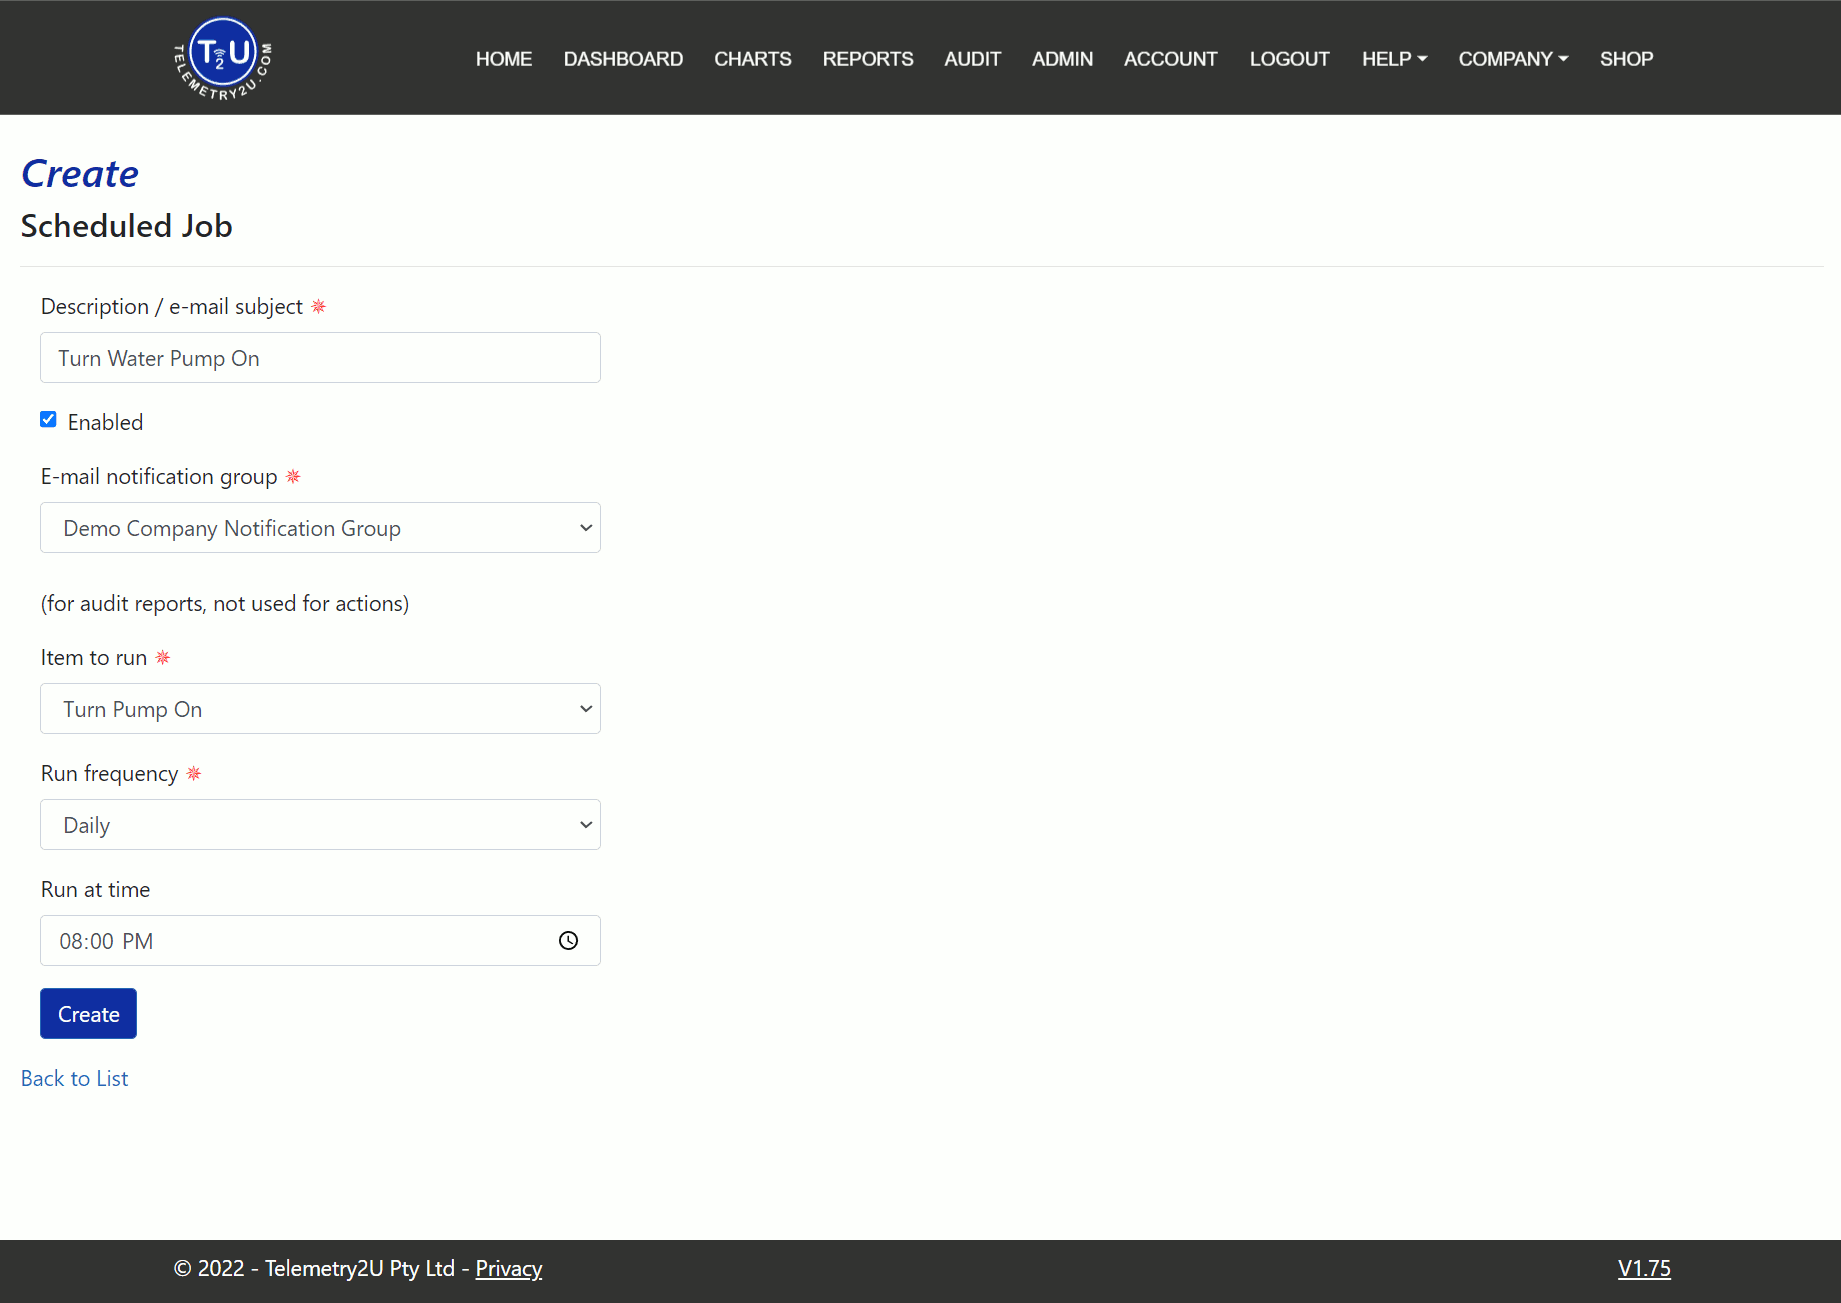
Open Create Action Schedule and complete:
- Description / Email Subject: schedule name shown on the index.
- Email Notification Group: not used when the scheduled item is an action.
- Item to Run: action group to execute.
- Run Frequency: daily, weekly, monthly, or another available interval.
- Run On: applicable day.
- Run At Time: execution time.
Select Enabled, then select Create to activate the schedule.
6.7.3 - Automating Actions
Assign an Alert Action and optional Recovery Action to an alert condition. When the condition enters the alert state, the alert action’s downlink commands are queued. When it returns to normal, the recovery action is queued.
Delivery time depends on the receiving device class and uplink behaviour. This workflow can automate tasks such as stopping a pump when a low-level condition occurs and restarting it after recovery.
The LoRaWAN automation guide provides a complete alert-to-action example.
6.8 - Network Integrations
Connect supported public LoRaWAN network servers so they can forward uplinks to the platform and receive queued downlinks.
Users with Gateway Admin can open Setup Integration. Select the network provider and ensure each node’s Network Provider setting matches the configured integration. Several integrations may coexist for different networks.
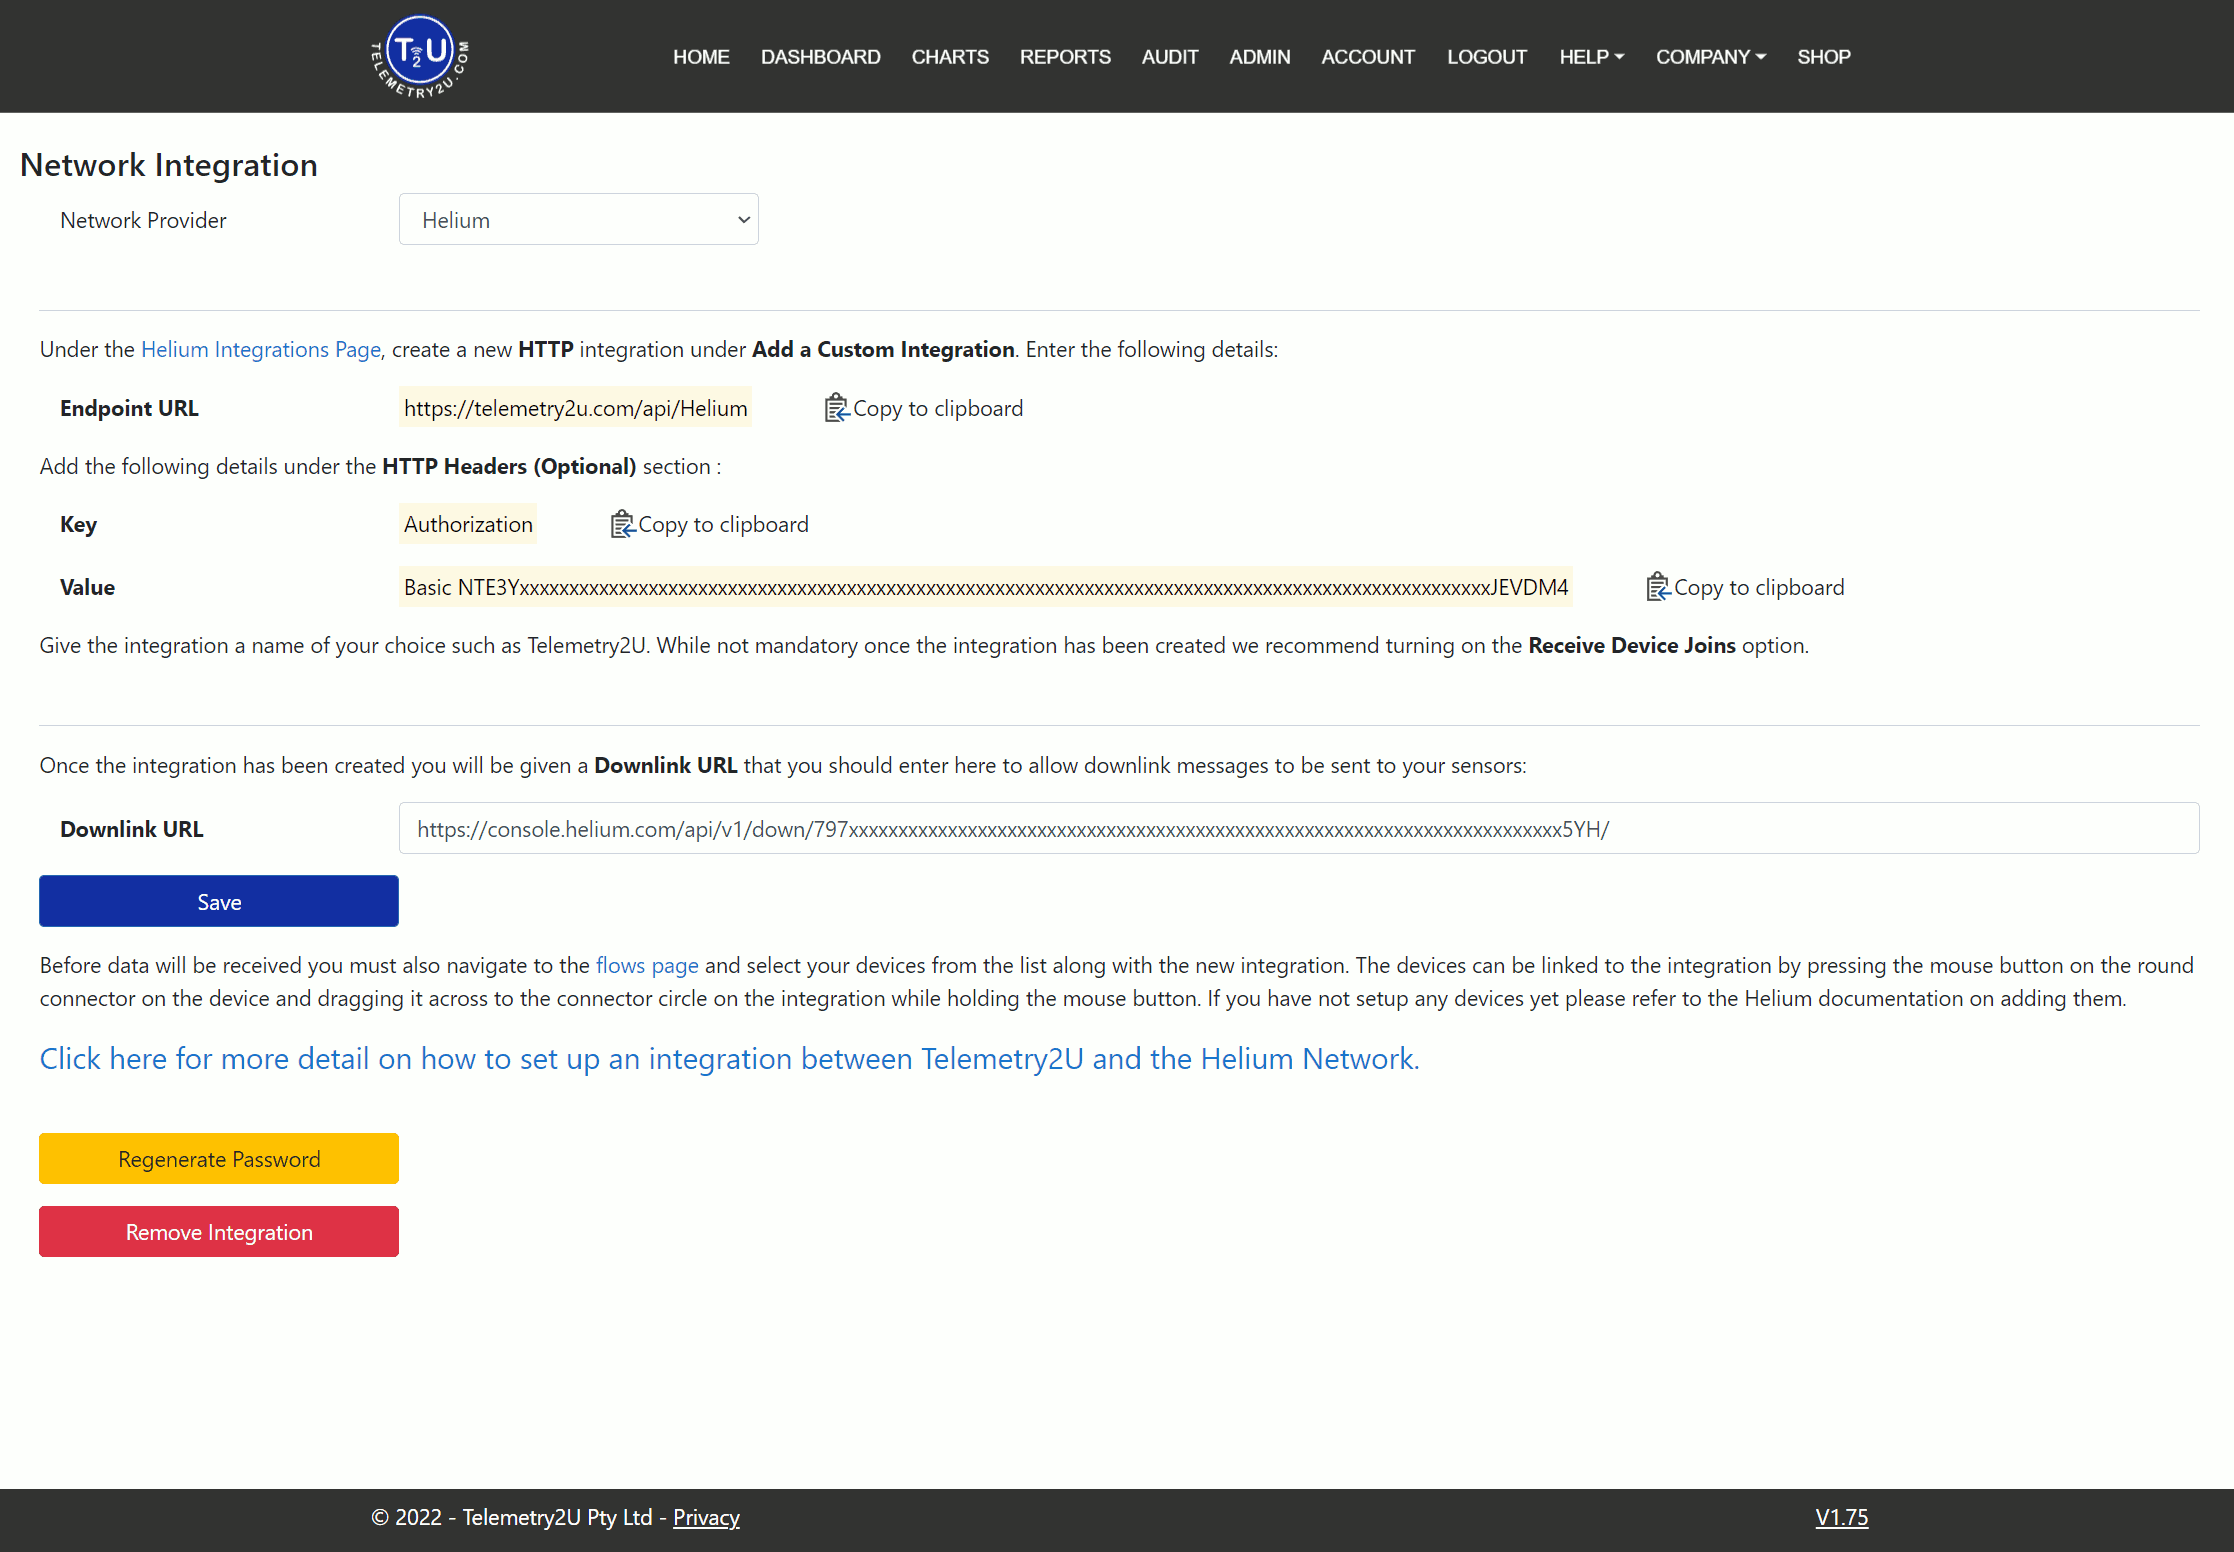
6.8.1 - Integrating with the Helium Network
Select Helium as the network provider. In the Helium console, create a custom HTTP integration using:
- Endpoint URL:
https://telemetry2u.com/api/Helium - Key:
Authorization - Value: the unique value displayed by the platform integration page.
Save the Helium integration, copy its Downlink URL, and paste that value into the platform integration settings. Select Save.
Use Regenerate Password to replace the authorisation value or Remove Integration to delete the connection.
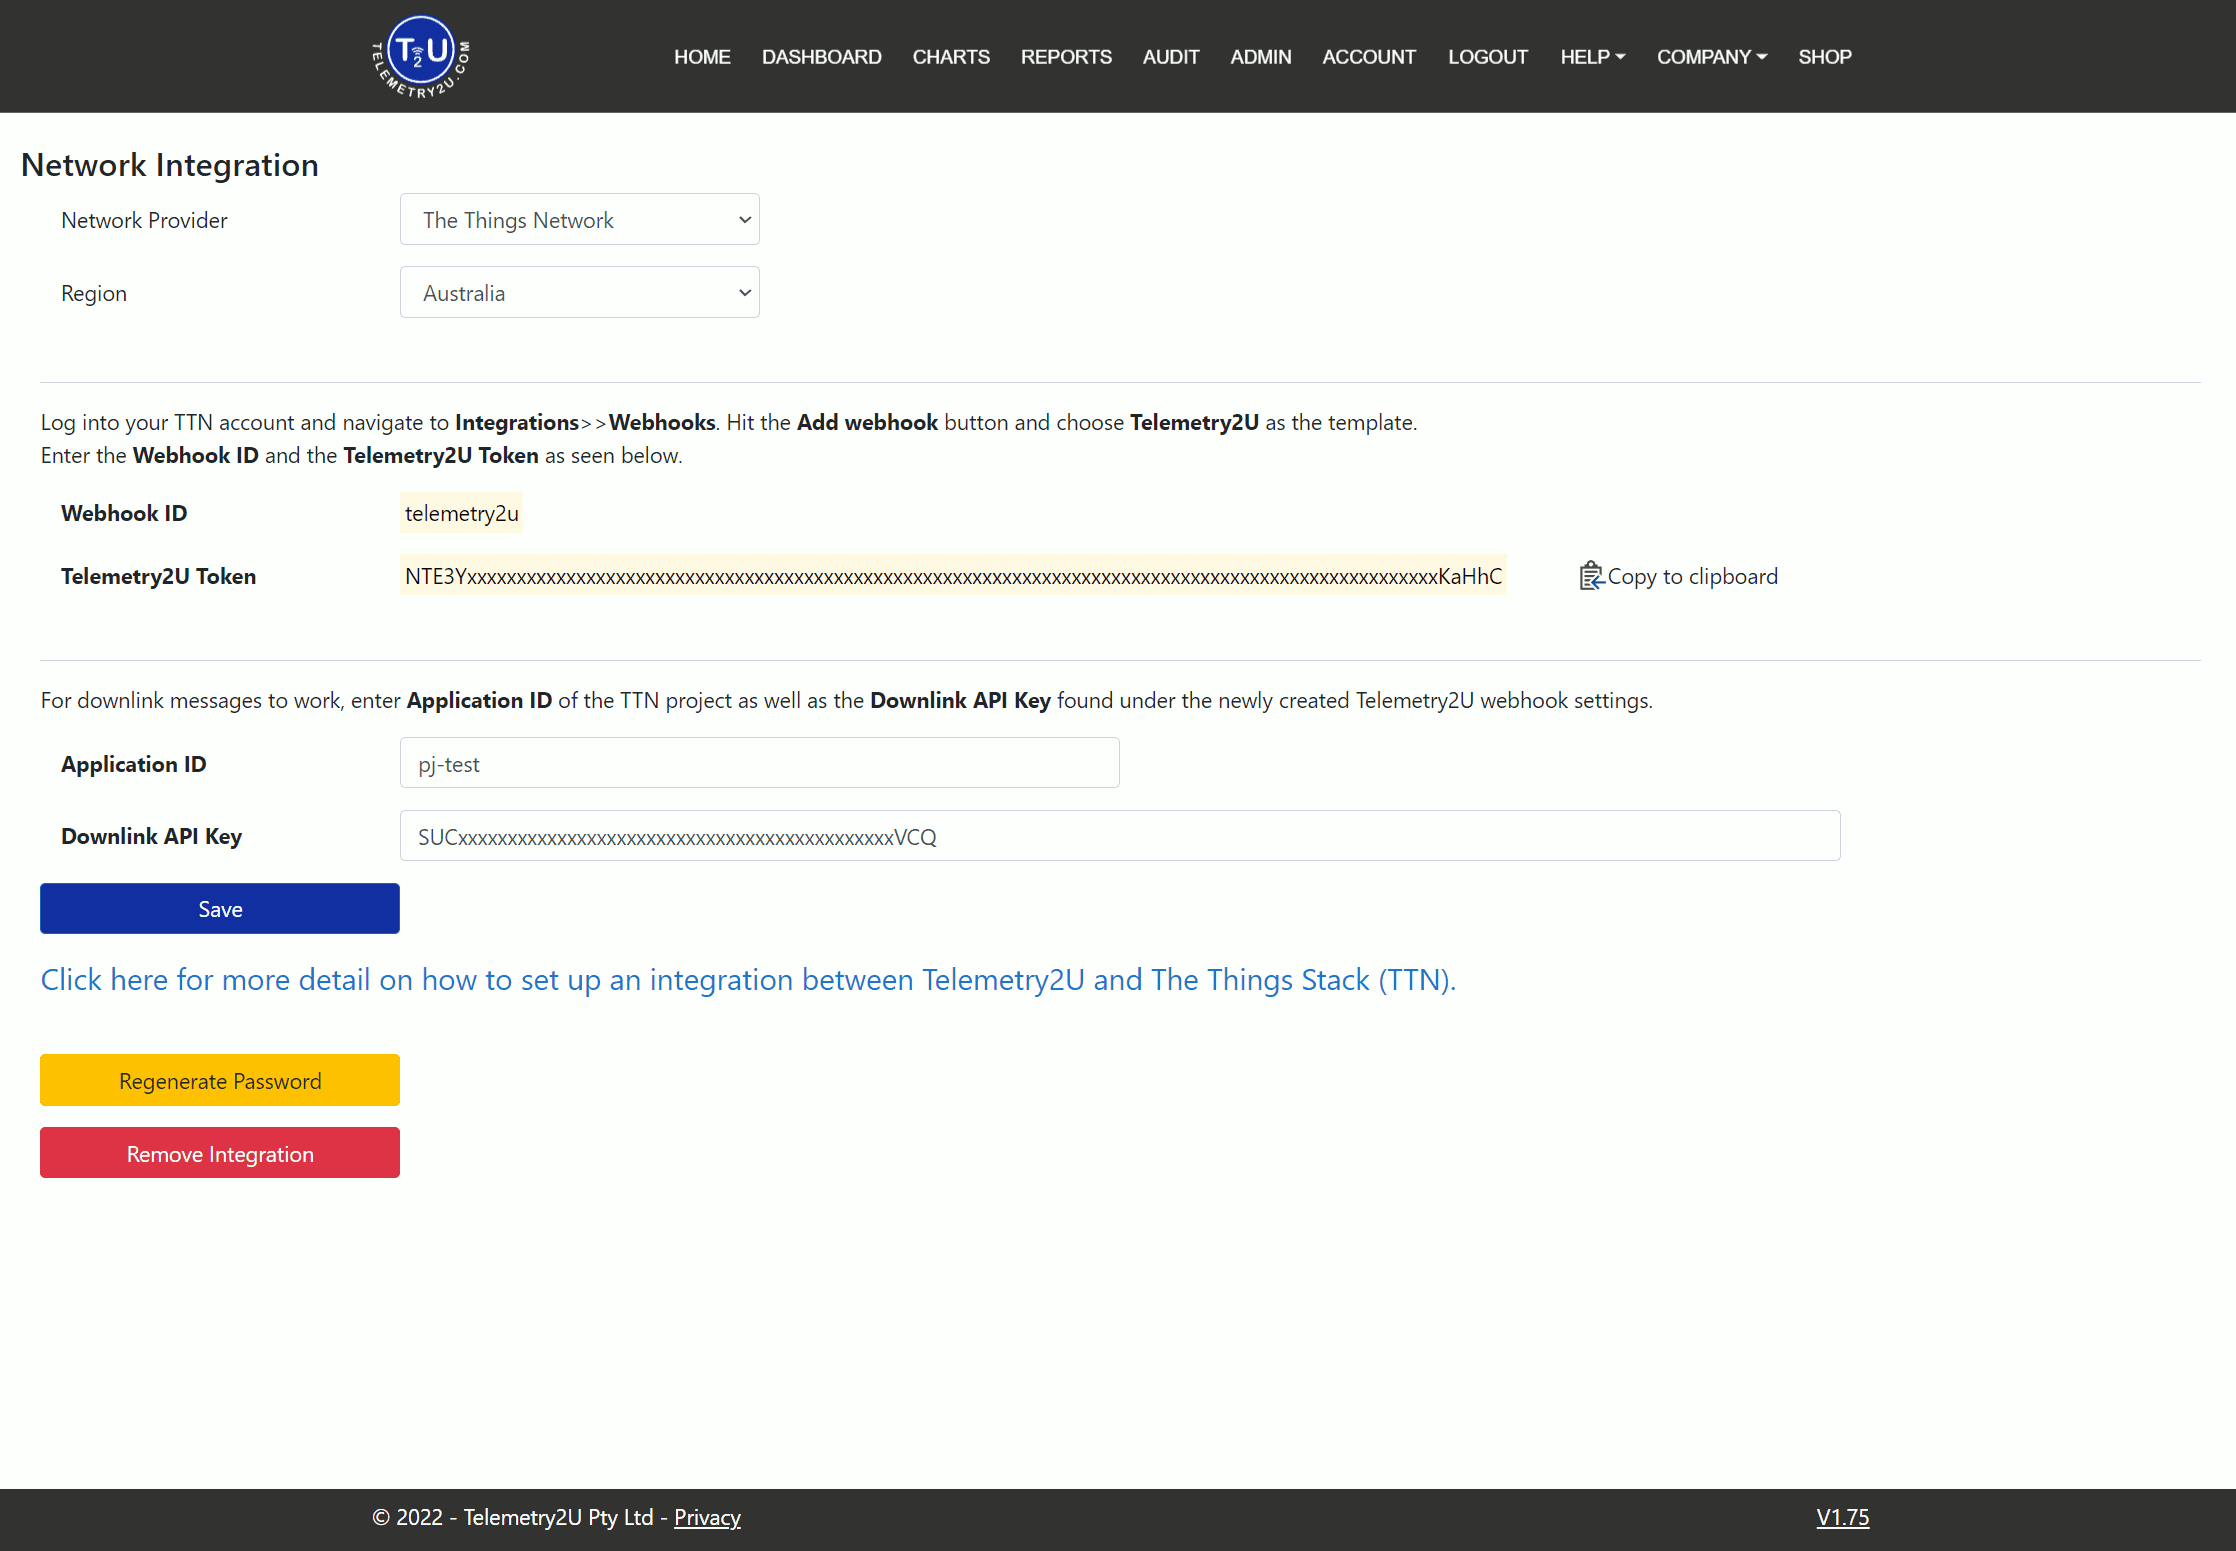
6.8.2 - Integrating with The Things Industries
Select TTN as the network provider and choose the appropriate Region. In The Things Stack console, create a webhook and enter:
- Webhook ID:
Telemetry2U - Telemetry2U token: the unique token displayed by the integration page.
After saving the webhook, copy the following values back to the platform:
- Application ID: application identifier configured in The Things Stack.
- Telemetry2U token: token used to authorise downlink commands.
Select Save. Use Regenerate Password to replace the token or Remove Integration to delete the connection.
For the network-console steps, see the The Things Industries cloud integration documentation.
6.9 - System Administration
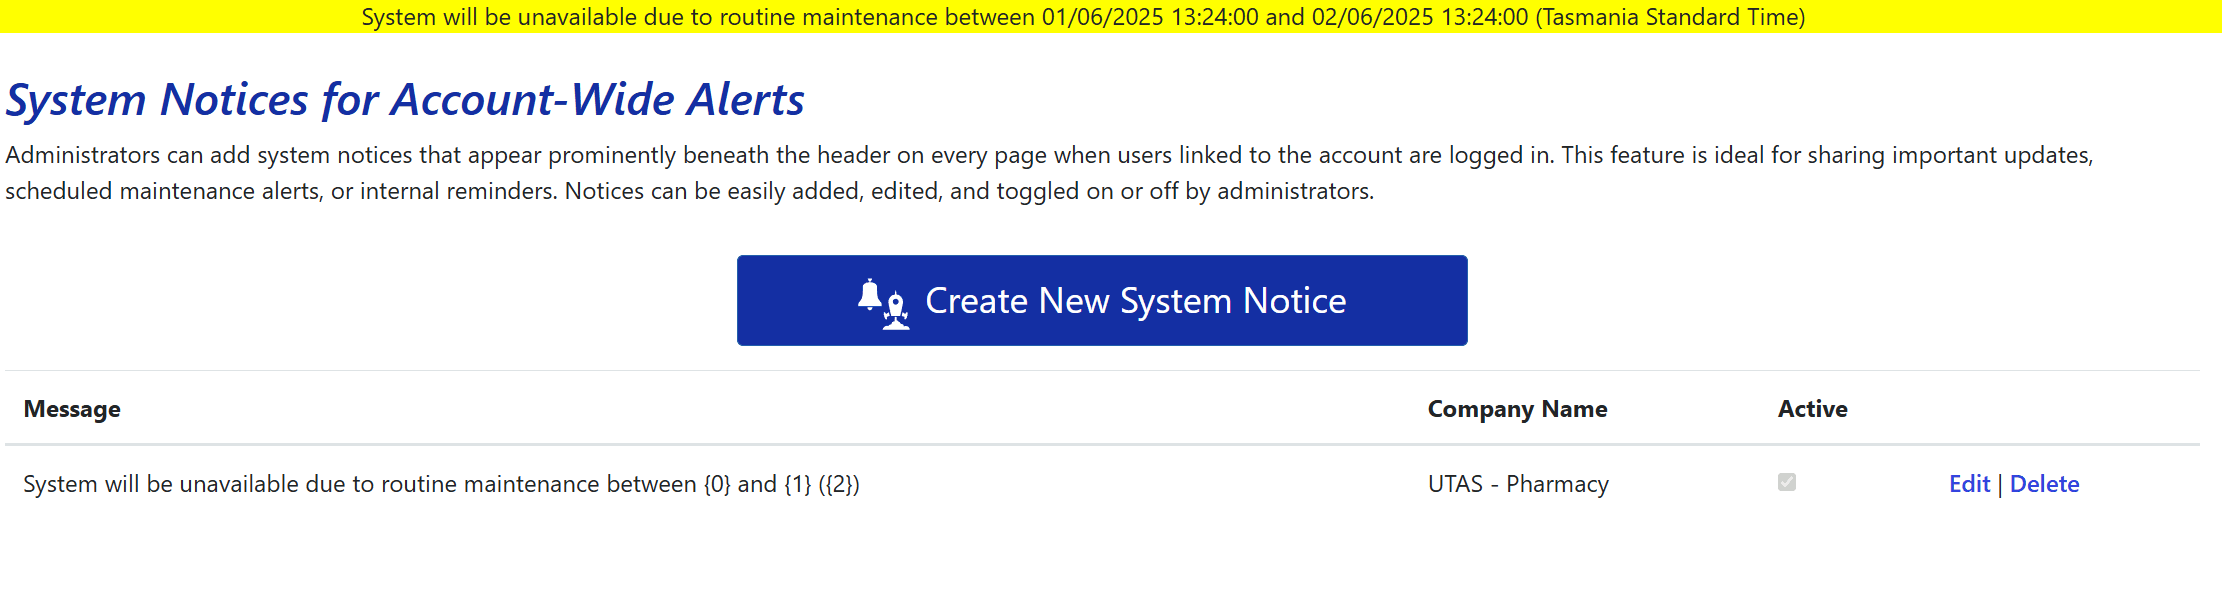
Company administrators can publish account-wide notices below the main header for every linked user.
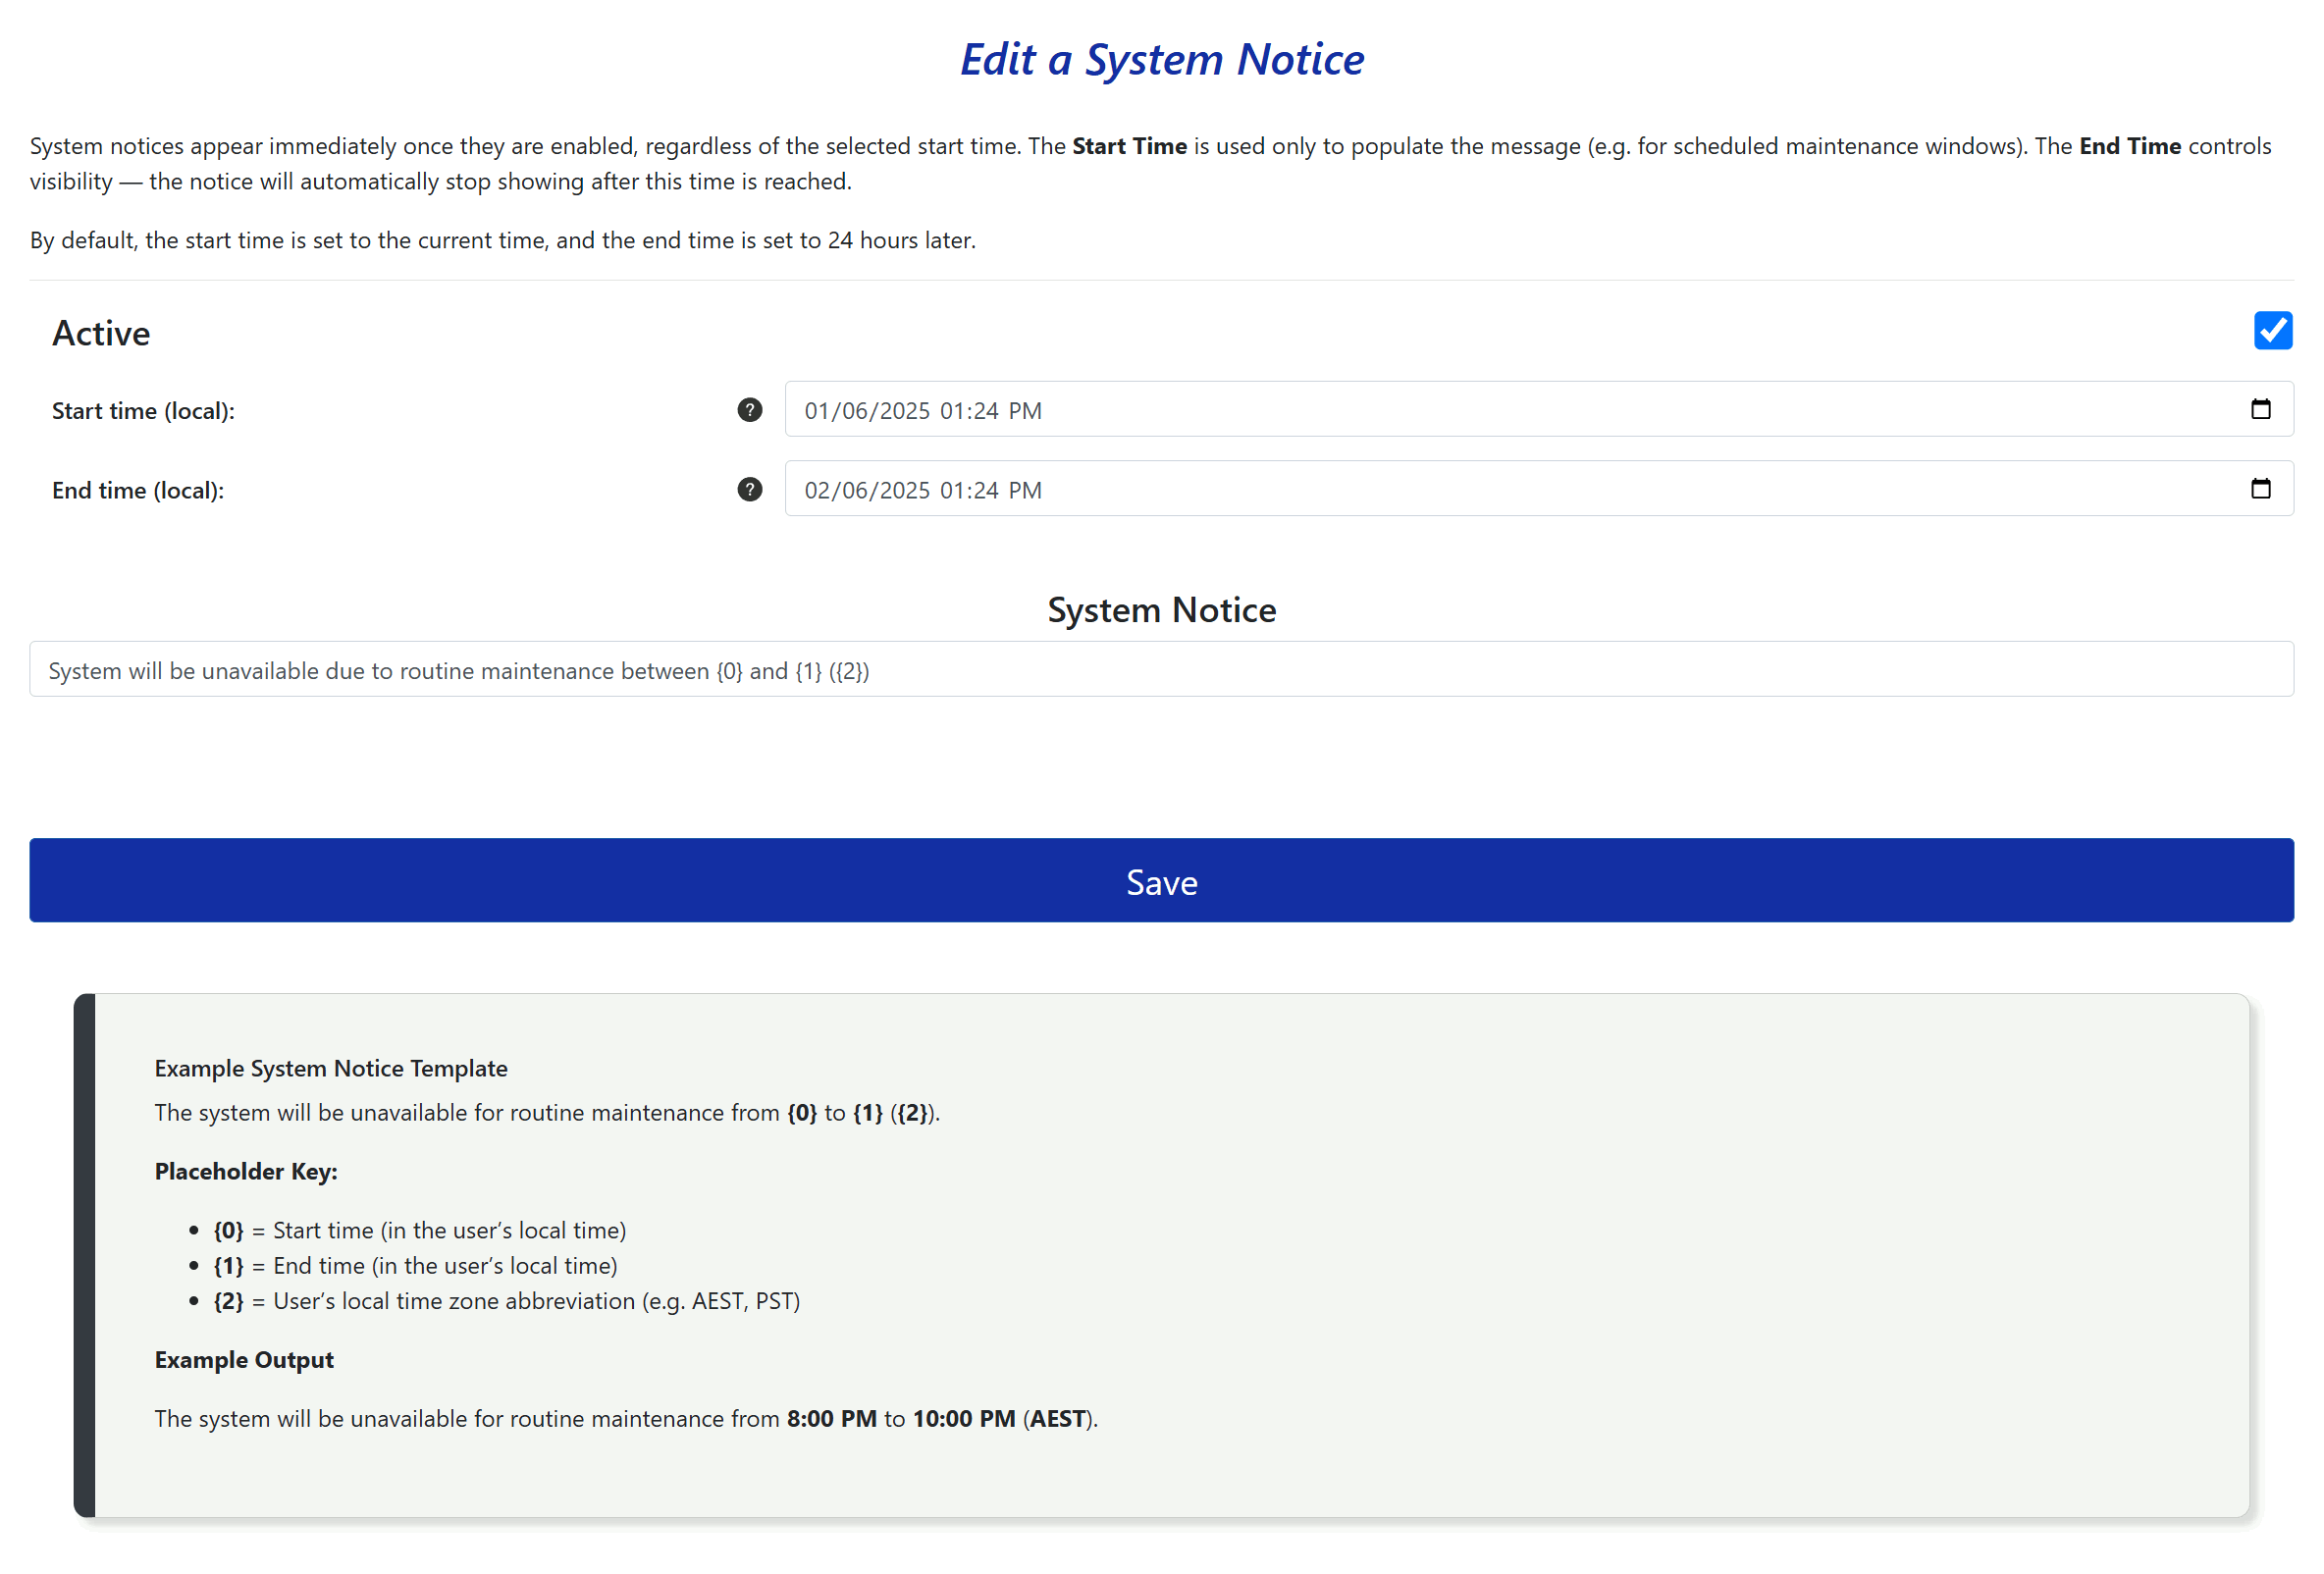
6.9.1 - Adding and Editing System Notices
Open System Messages to view existing notices. Use Edit or Delete beside a row, or select Create New System Notice.
Notices are useful for scheduled maintenance, service interruptions, policy updates, and other account-wide information.
System notice fields
- Active: displays or hides the notice. Enabling it displays the notice immediately.
- Start Time: supplies the
{0}placeholder and is displayed in each user’s local time zone; it does not delay publication. - End Time: supplies the
{1}placeholder and automatically removes the notice when the end time is reached. - Message: notice text, optionally containing
{0},{1}, and{2}.
Message placeholders
{0}- start time in the user’s local time zone.{1}- end time in the user’s local time zone.{2}- local time-zone abbreviation.
The system will be unavailable for routine maintenance from {0} to {1} ({2}).
The system will be unavailable for routine maintenance from 8:00 PM to 10:00 PM (AEST).