4.1 - Reports Page
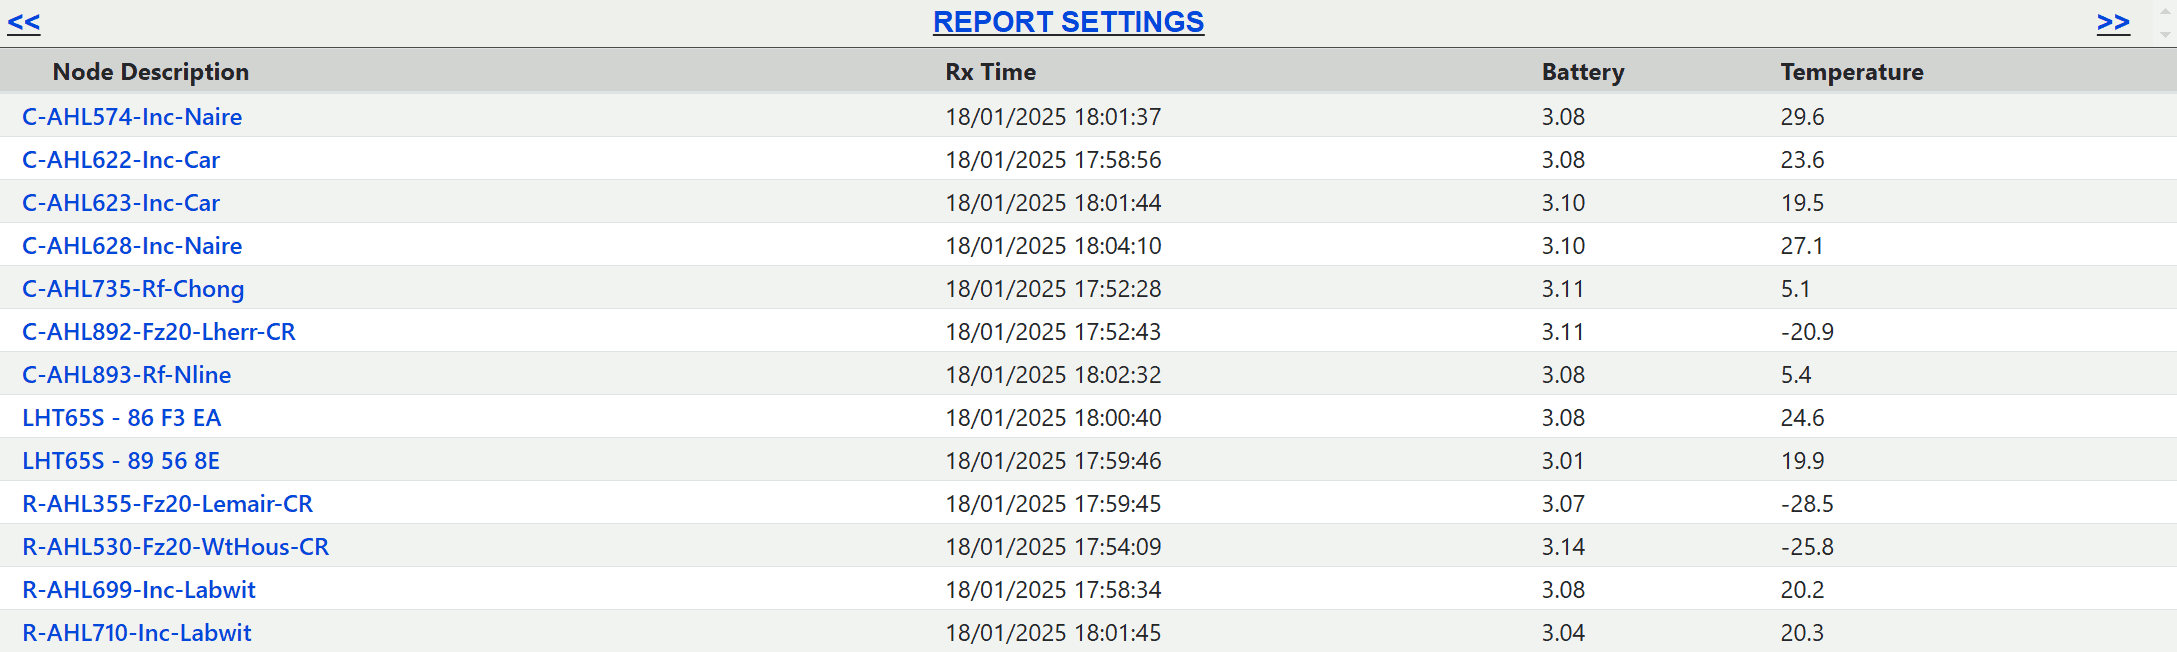
The Reports page presents monitoring records in a table and provides controls for selecting nodes, time ranges, report types, calibration handling, and export formats.
Reports are available to all signed-in users, but each user can only view nodes assigned through their user access settings . The page initially shows recent readings for the selected node and can load historical records for a defined period.
Configure the Report
Select Report Settings at the top of the page to open the report configuration panel.

Select a Node
Choose a node from the list. After selection, the report loads the most recent 24 hours of data for that node.
Set the Time Range
Enter a Start Date and End Date, or use a quick range for 1 day, 2 days, 1 week, 2 weeks, or 1 month.
Choose a Report Type
Select converted sensor data, alert history, sent commands, join requests, or raw hexadecimal data.
Control Calibration
Enable Show Uncalibrated when you need to review values before any configured calibration is applied.
Load the Records
Select Load to retrieve the chosen report. A selected period is limited to 10,000 records.
Download the Data
Open the arrow beside Load to download the current report in an available format such as CSV or Excel.
Available Report Types
Data Report
Displays converted sensor readings and is the default report type.
Alert History
Lists triggered alerts together with the notification activity recorded for them.
Sent Commands
Lists commands sent by users linked to the company account.
Join Requests
Lists network join requests received from sensors linked to the company account.
Raw Data
Displays raw hexadecimal payload data for troubleshooting and decoder development.
4.2 - Report Icons and Colours
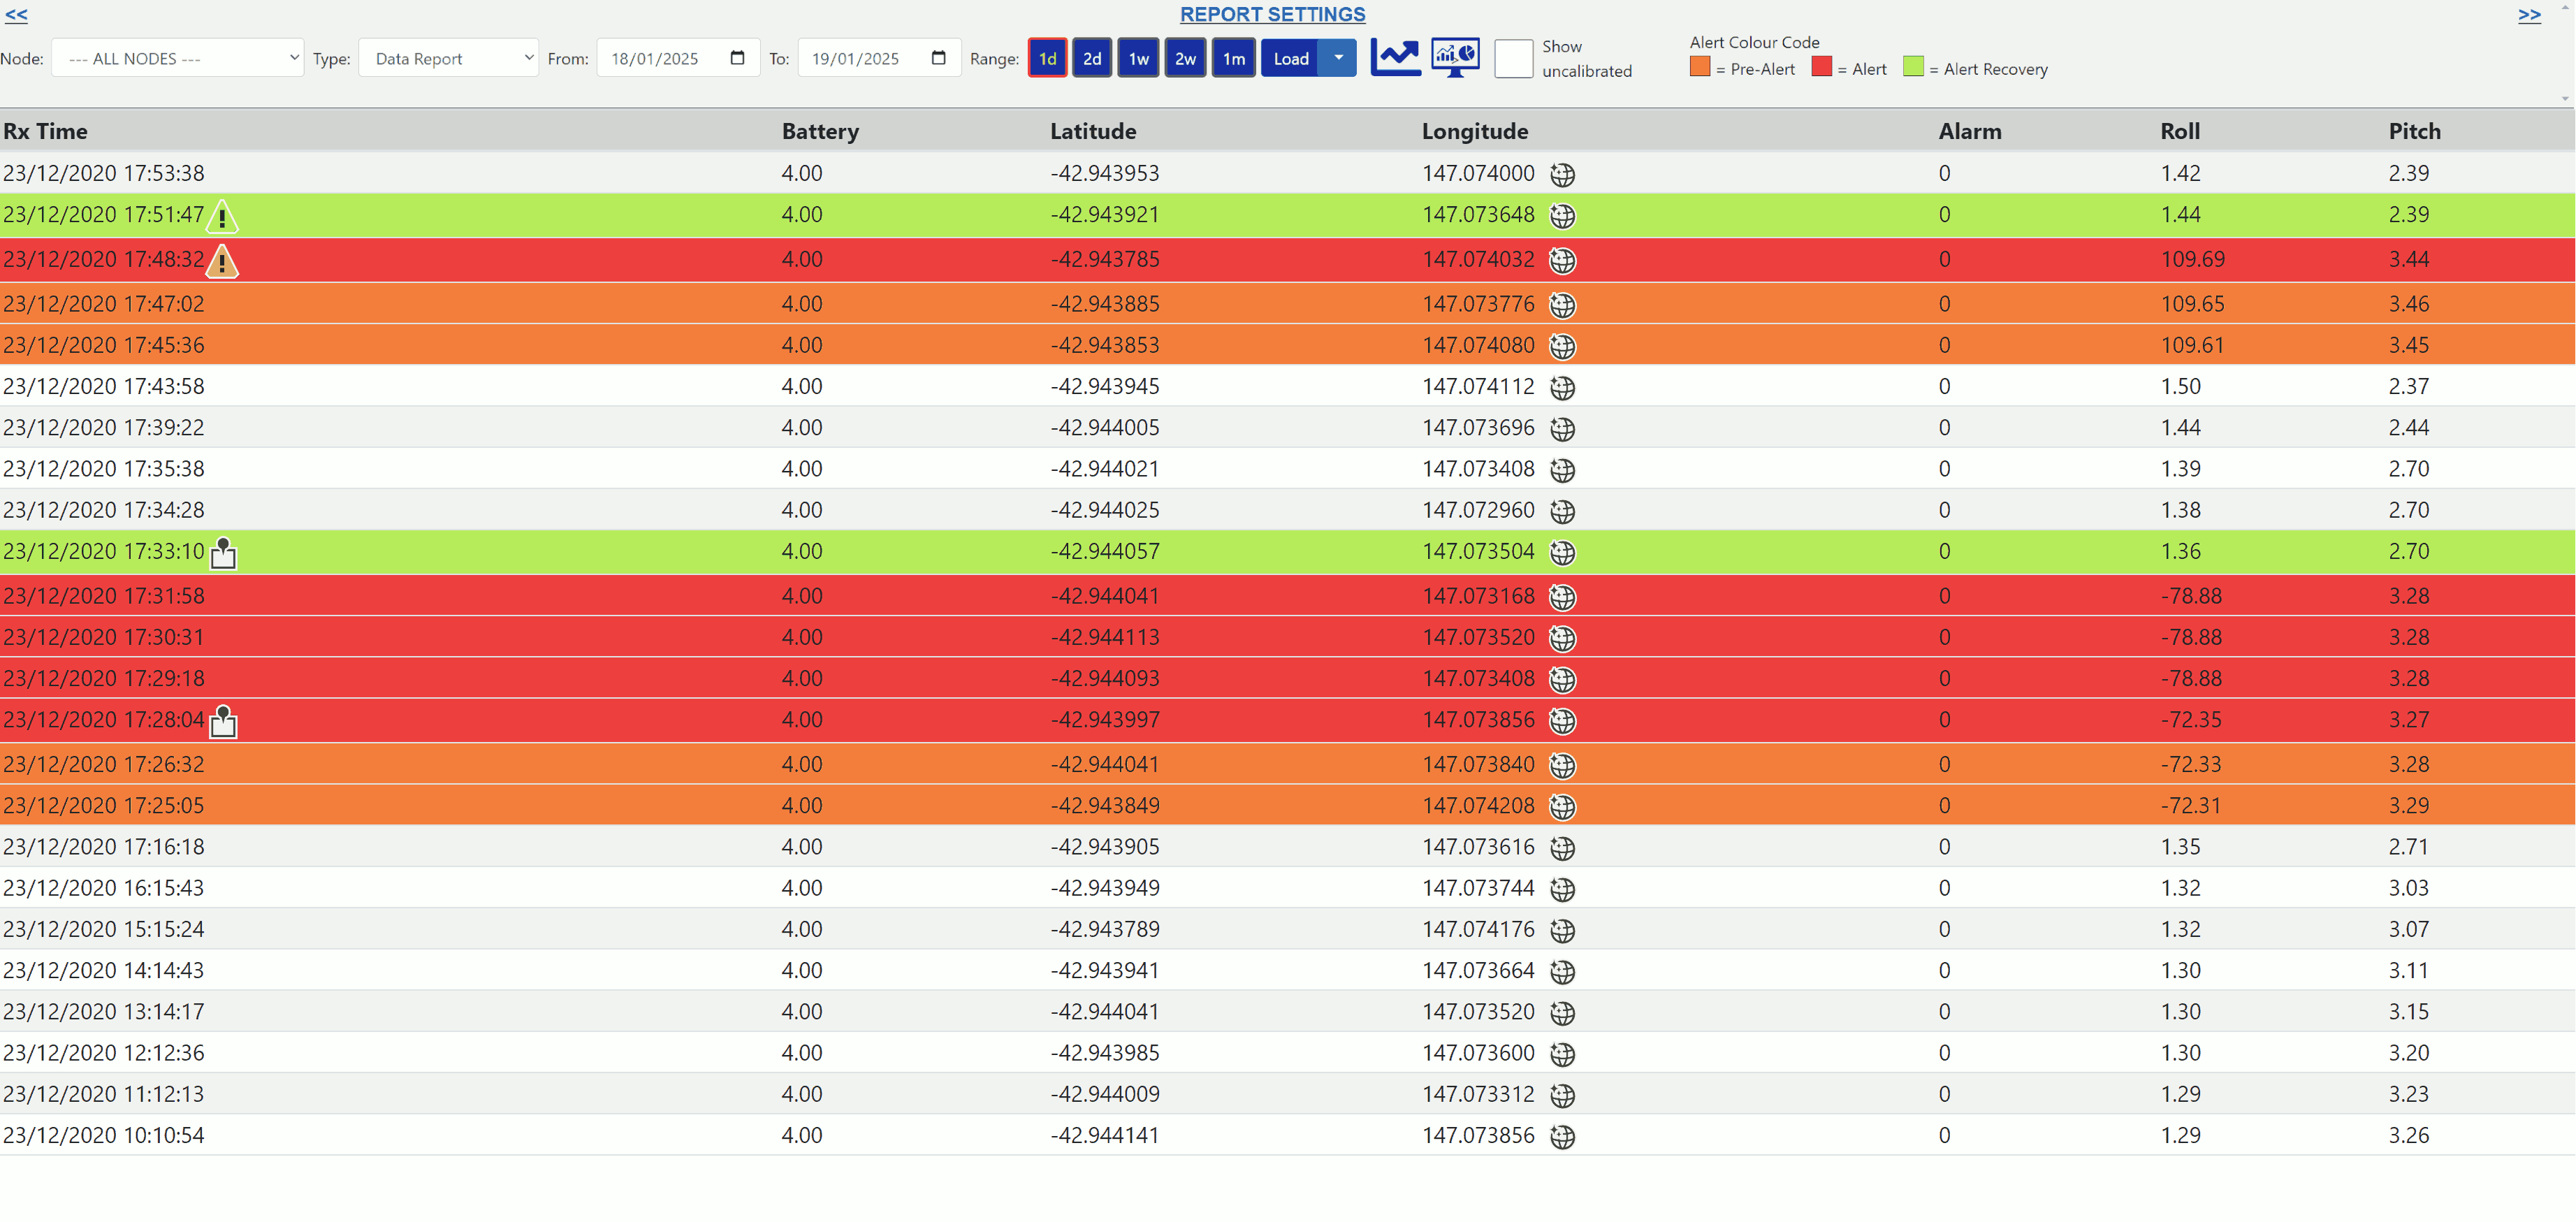
Report icons identify available actions and recorded events, while row colours show the current stage of an alert condition.
The example below shows a report for the LGT92 GPS/Motion Sensor Demo, including normal records, pending alert conditions, active alerts, and recoveries.
Report Icons

Open Map
Opens a recorded position using the map provider selected for the user account. Company administrators can choose Google Maps, OpenStreetMap, or Bing Maps in User Maintenance .

Alert Condition
Indicates that a node entered an alert condition. Users with Add Annotation permission can select the icon to add a note to the alert event.

Recovered Alert
Indicates that a node recovered from an alert condition. Authorised users can select the icon to annotate the recovery event.

Annotation Available
Indicates that an annotation has been saved against an alert or recovery. Users with Add Annotation permission can select it again to edit or delete the annotation.
Report Row Colours
Orange: Pending Alert
The input has met an alert condition but has not yet reached the configured number of consecutive readings required to trigger notifications.
Red: Active Alert
The alert condition has been triggered, notifications have been sent, and any linked actions have been performed.
Green: Recovered
The input has recovered from the alert condition, recovery notifications have been sent, and any linked recovery actions have been performed.
4.3 - Adding and Editing Annotations
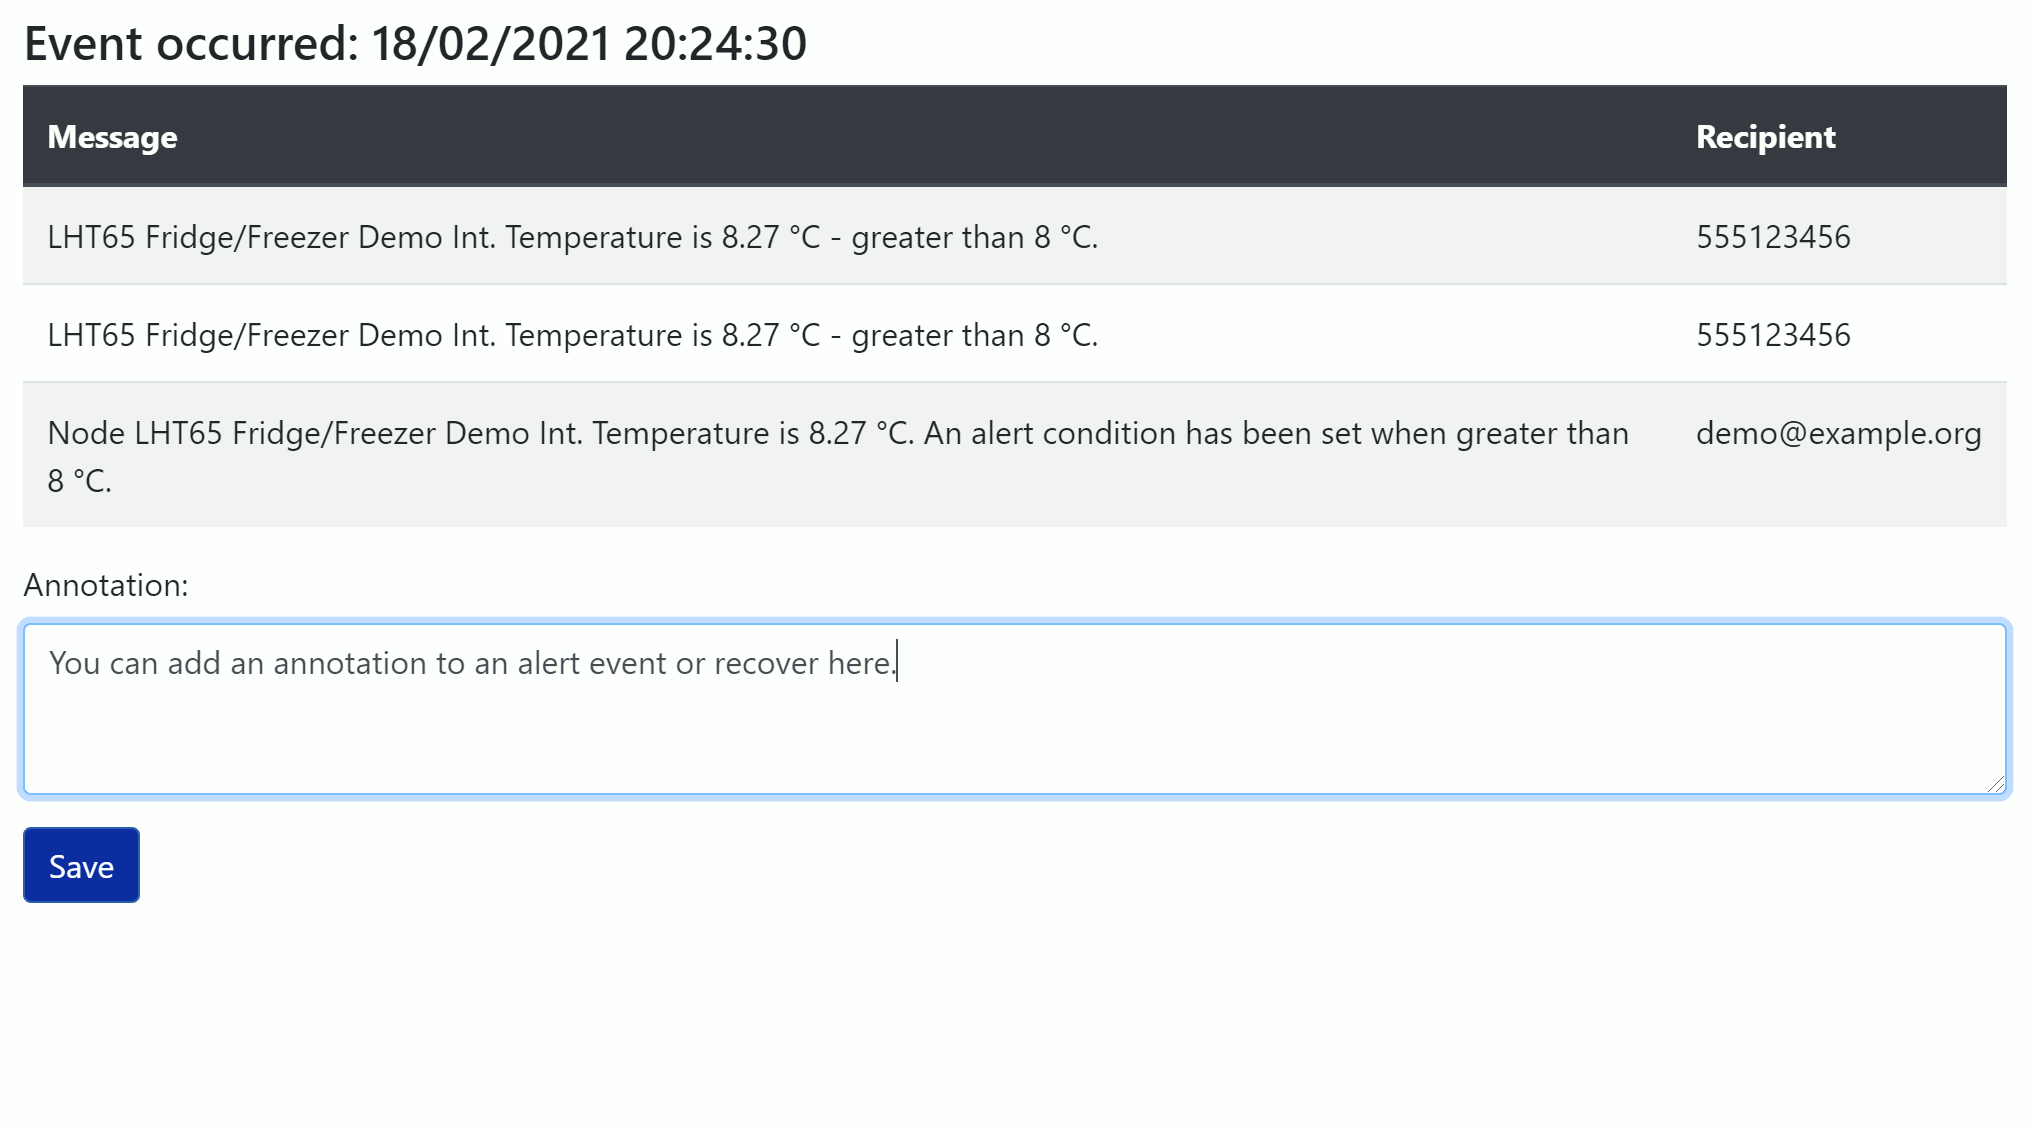
Annotations create a permanent explanatory note against an alert or recovery event.
Users with Add Annotation permission in User Access can add, edit, or delete annotations. Other users can view saved annotations but cannot change them.
- To add a note, select the Warning icon on an active alert or the Recovered icon on a recovery record.
- Enter the required text in the Annotation field and save it.
- To revise an existing note, select the Annotation icon. The window shows the alert details, notification recipients, and annotations entered by users.
Saved annotations are displayed on the Reports and Charts pages and can be included in an Audit Report containing the node.
4.5 - Period Statistics
Period Statistics compares a shared input from one or more compatible nodes over daily, weekly, or monthly intervals.
Available calculations include Total, Average, Minimum, Maximum, and Standard Deviation. Results are displayed in both a table and chart and can be exported for further analysis.
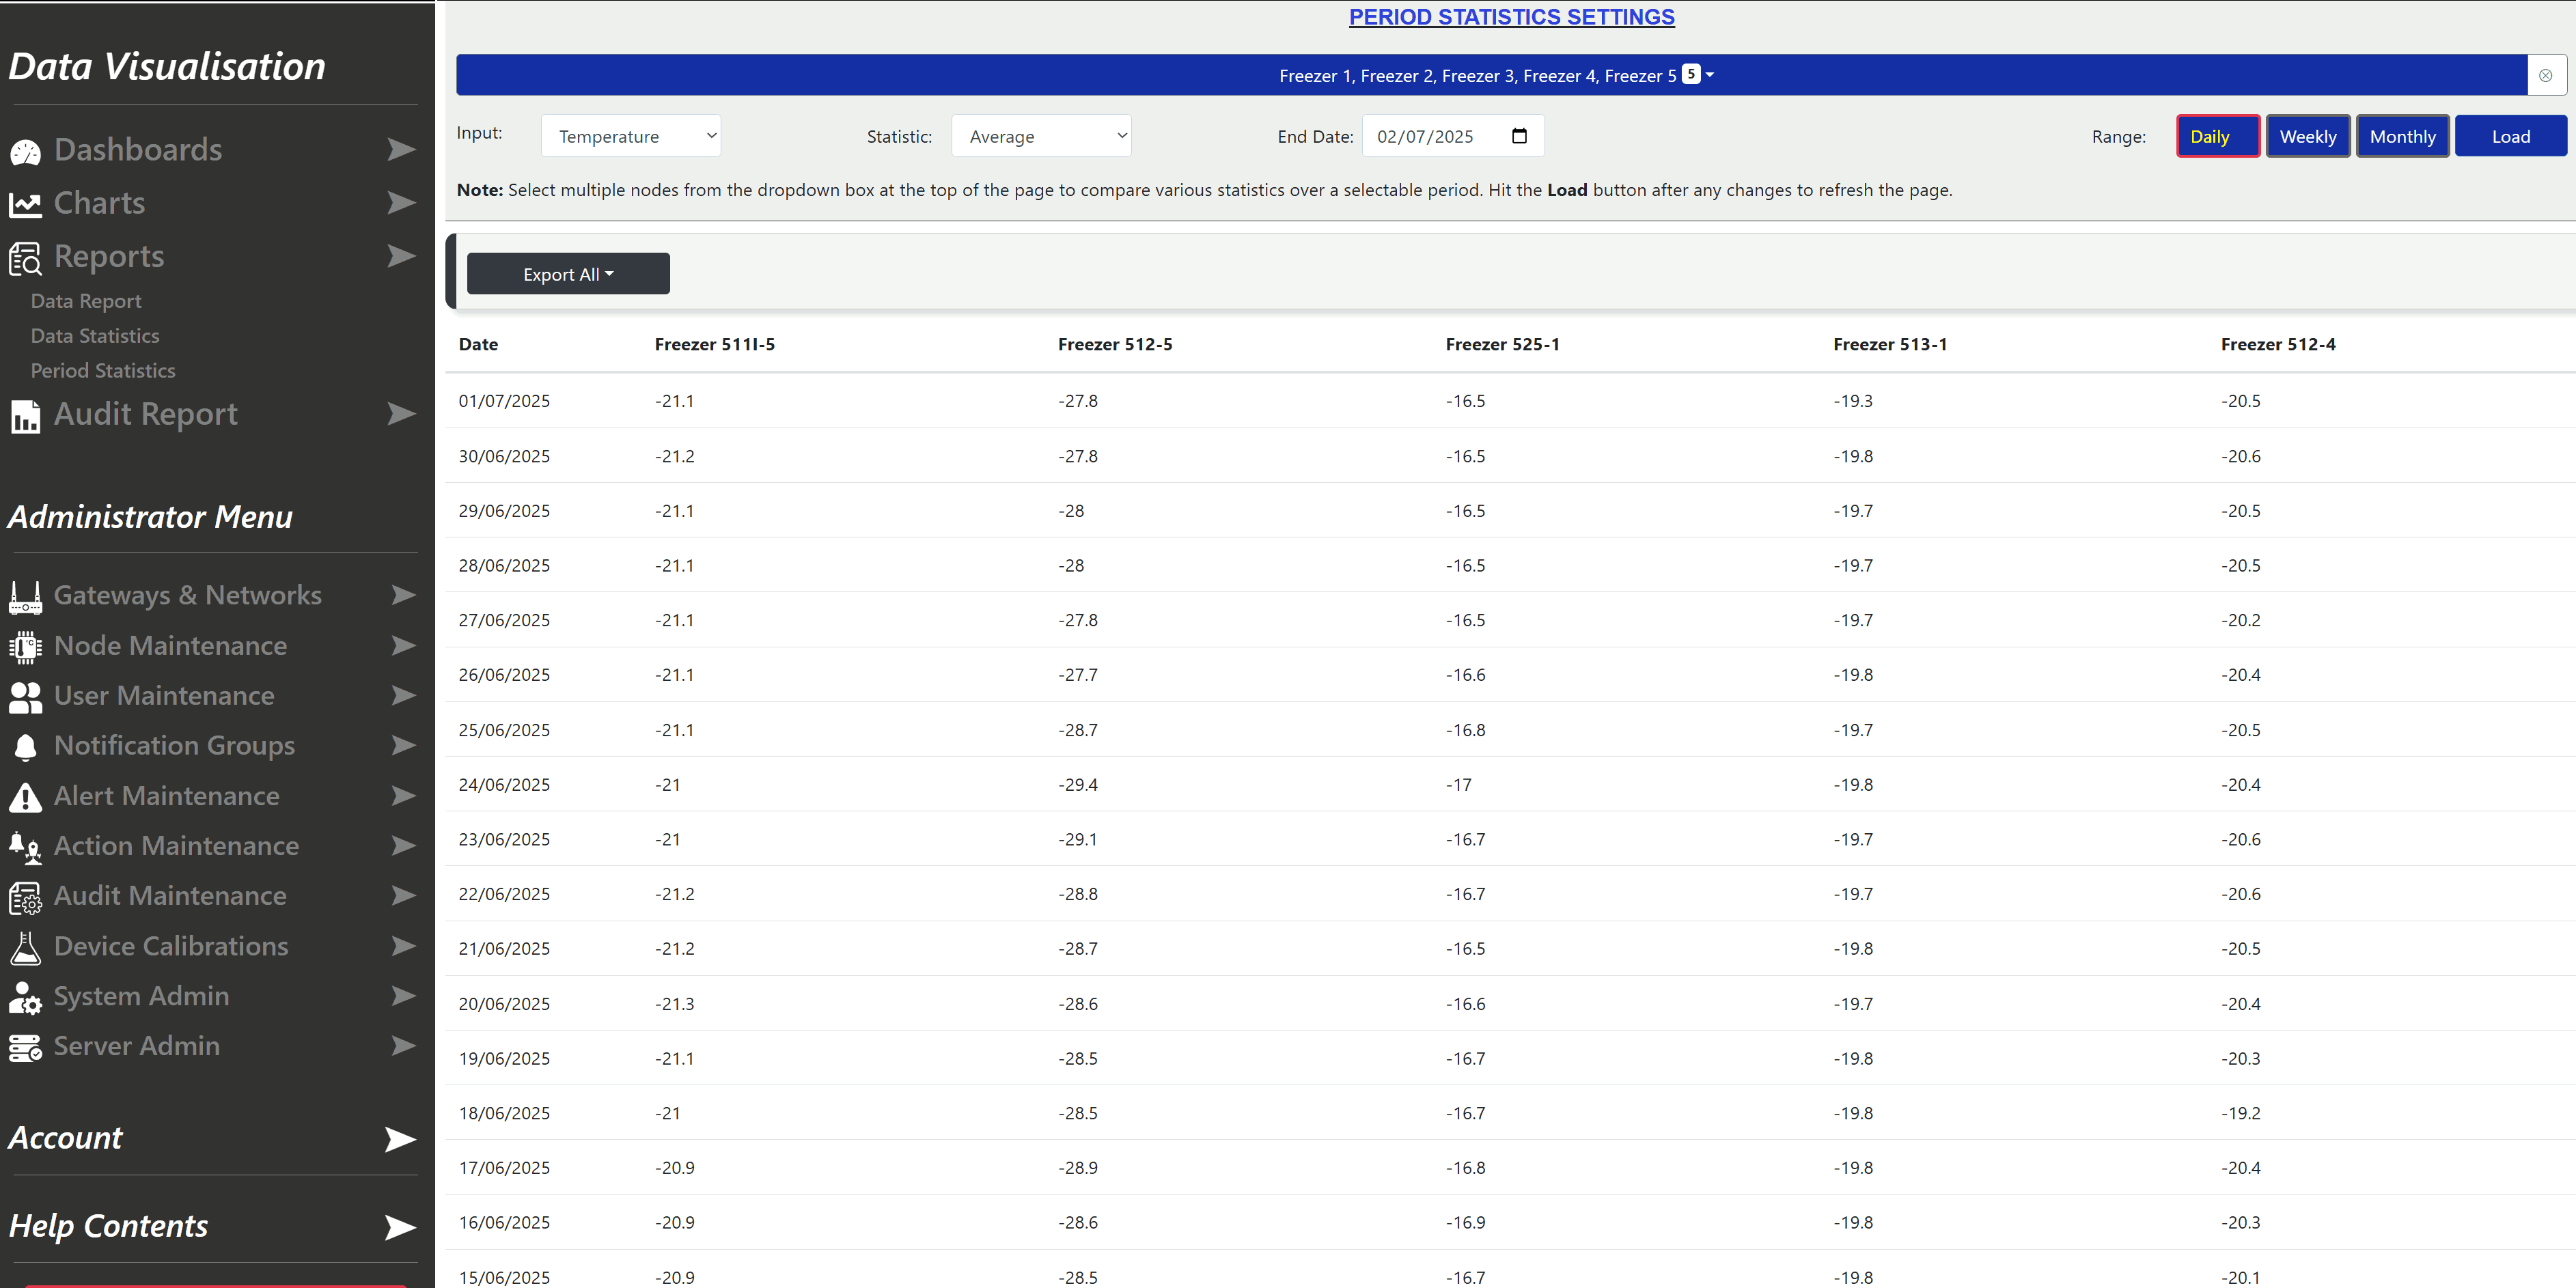
Generate Period Statistics
- Open Reports from the side menu and select Period Statistics. The page retains your last-used settings.
- Select Select Nodes, then choose one or more nodes using the checkboxes.
- Select Load to identify inputs shared by all selected nodes.
- Choose the input to analyse and the statistic to calculate.
- Choose Daily, Weekly, or Monthly, and set an end date when required. The report includes data leading up to that date.
- Select Load again to generate the table and chart.
Select Export All to download the result in an available Excel, CSV, or PDF format.