How to Add Annotations to Alert Events in Telemetry2U
This guide provides step-by-step instructions on how to add annotations to alert events in Telemetry2U. Annotations help document event responses and are visible in audit reports, as well as on the Charts and Reports pages.
Why Annotations Matter for Alert Events in Telemetry2U
It’s common for users to configure alerts in Telemetry2U when sensor inputs drift outside defined thresholds. These alert events can trigger email, SMS, or voice notifications, and can also initiate automated actions—such as controlling other connected devices.
In regulated environments—such as cold storage temperature monitoring for hospitals, laboratories, and pharmacies—compliance with standards like NATA, NIST, FDA, or TGA often requires that every alert event be documented and explained.
The Telemetry2U IoT platform makes it easy to add annotations to alert events, helping users maintain accurate records and meet regulatory requirements. This guide will walk you through how to both add and review annotations using the platform’s built-in tools.
What You Need Before Adding Annotations in Telemetry2U
- A fully configured account on the Telemetry2U IoT platform.
- The Add Annotations role assigned to your user account. This can be configured under User Access in the User Maintenance section.
How to Add Annotations to Sensor Alert Conditions on the Reports Page
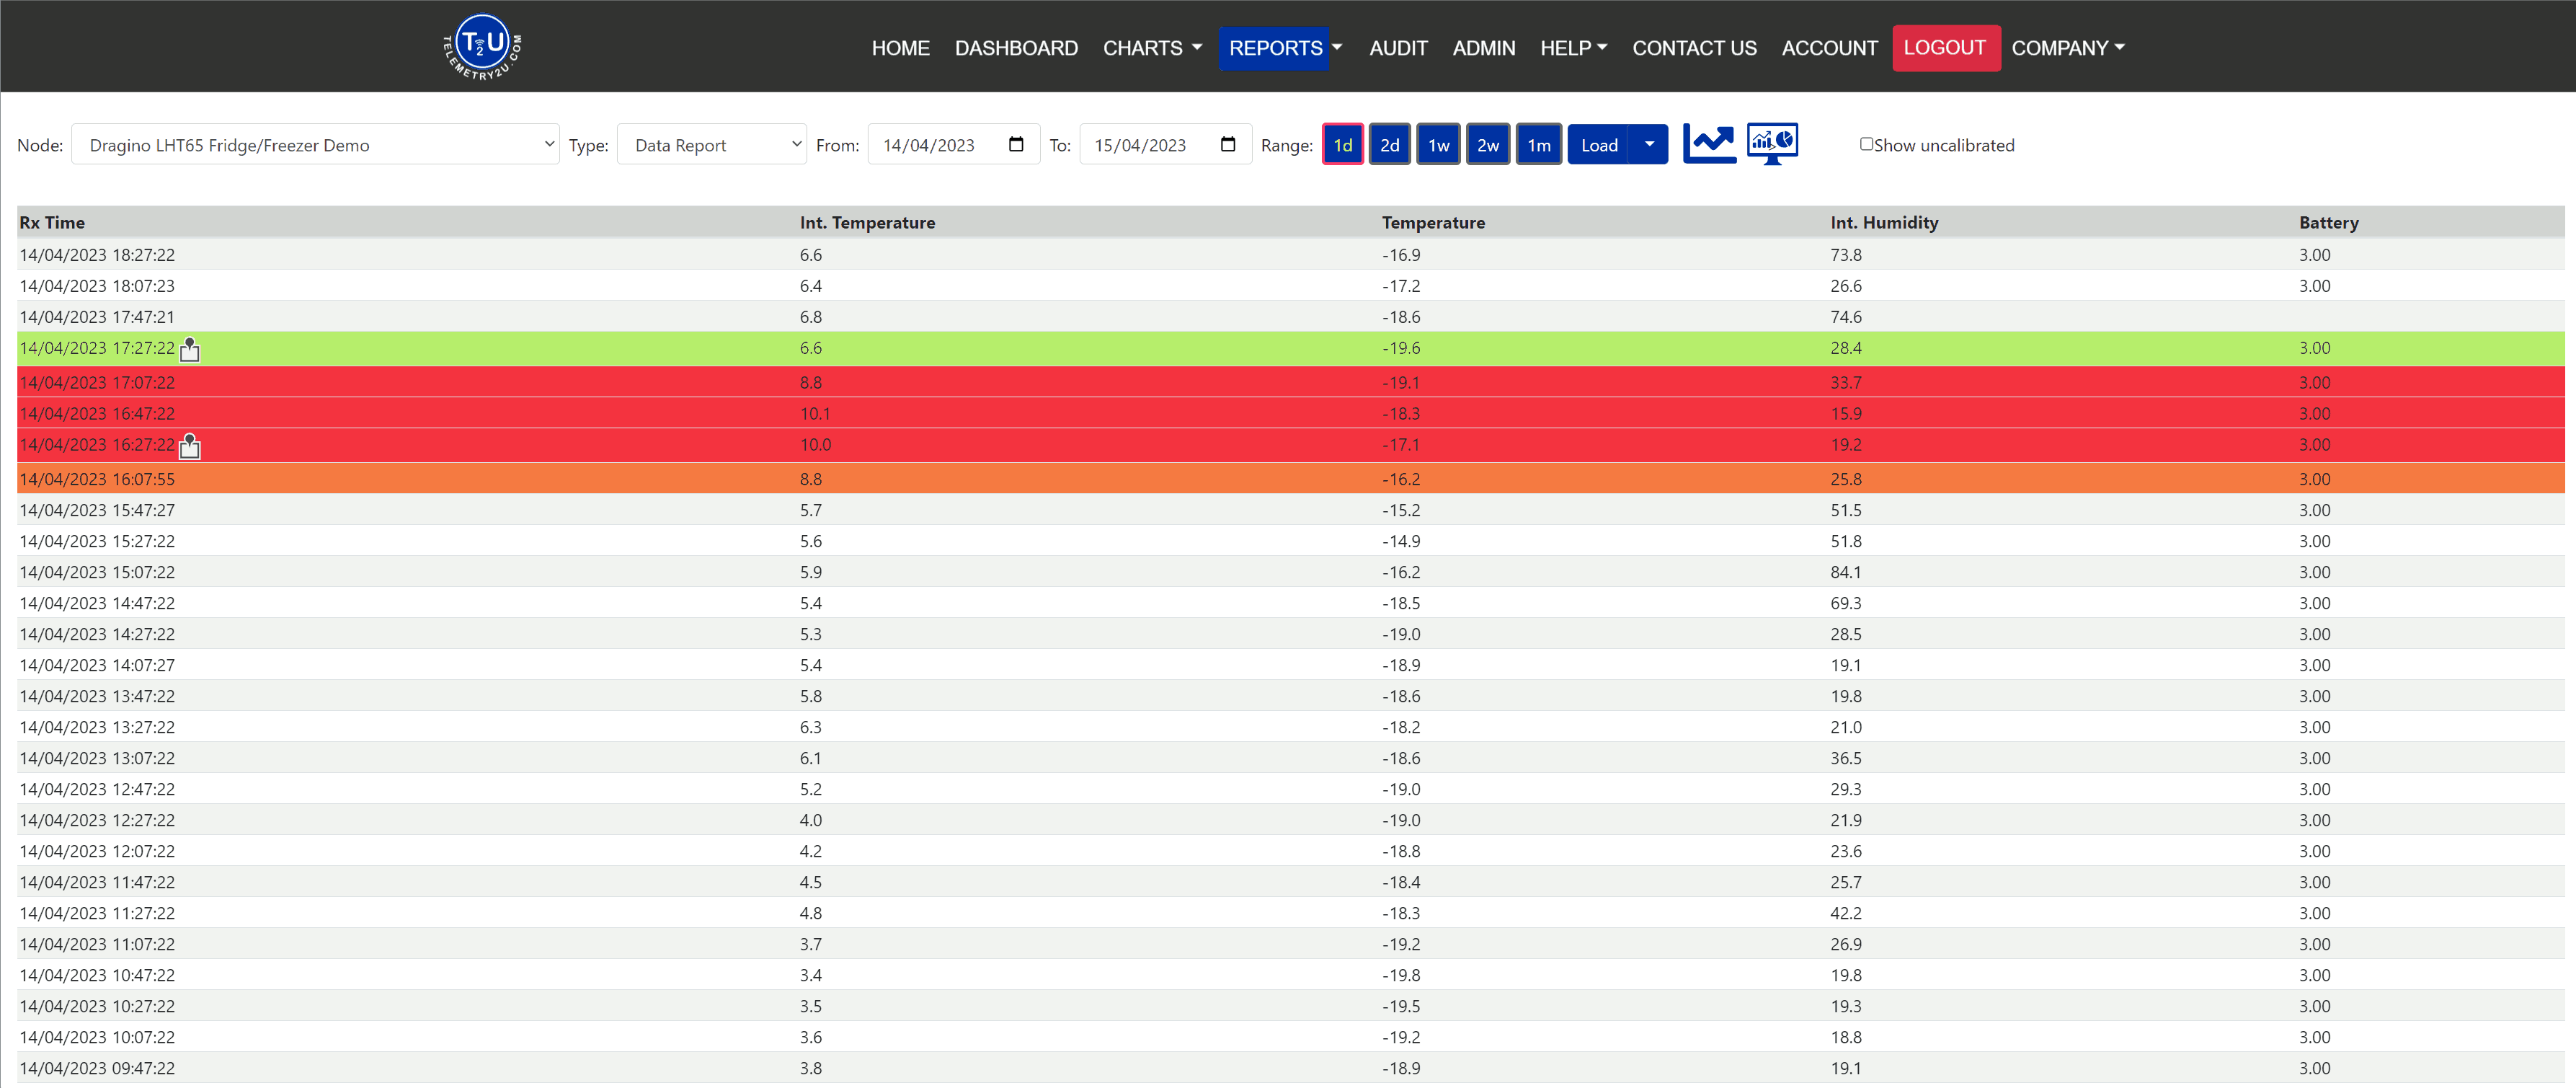
You can view sensor alert conditions on the Dashboard, Charts, and Reports pages. However, annotations can only be added to alert conditions via the Reports page. This page uses colour coding to make alert states easy to identify.
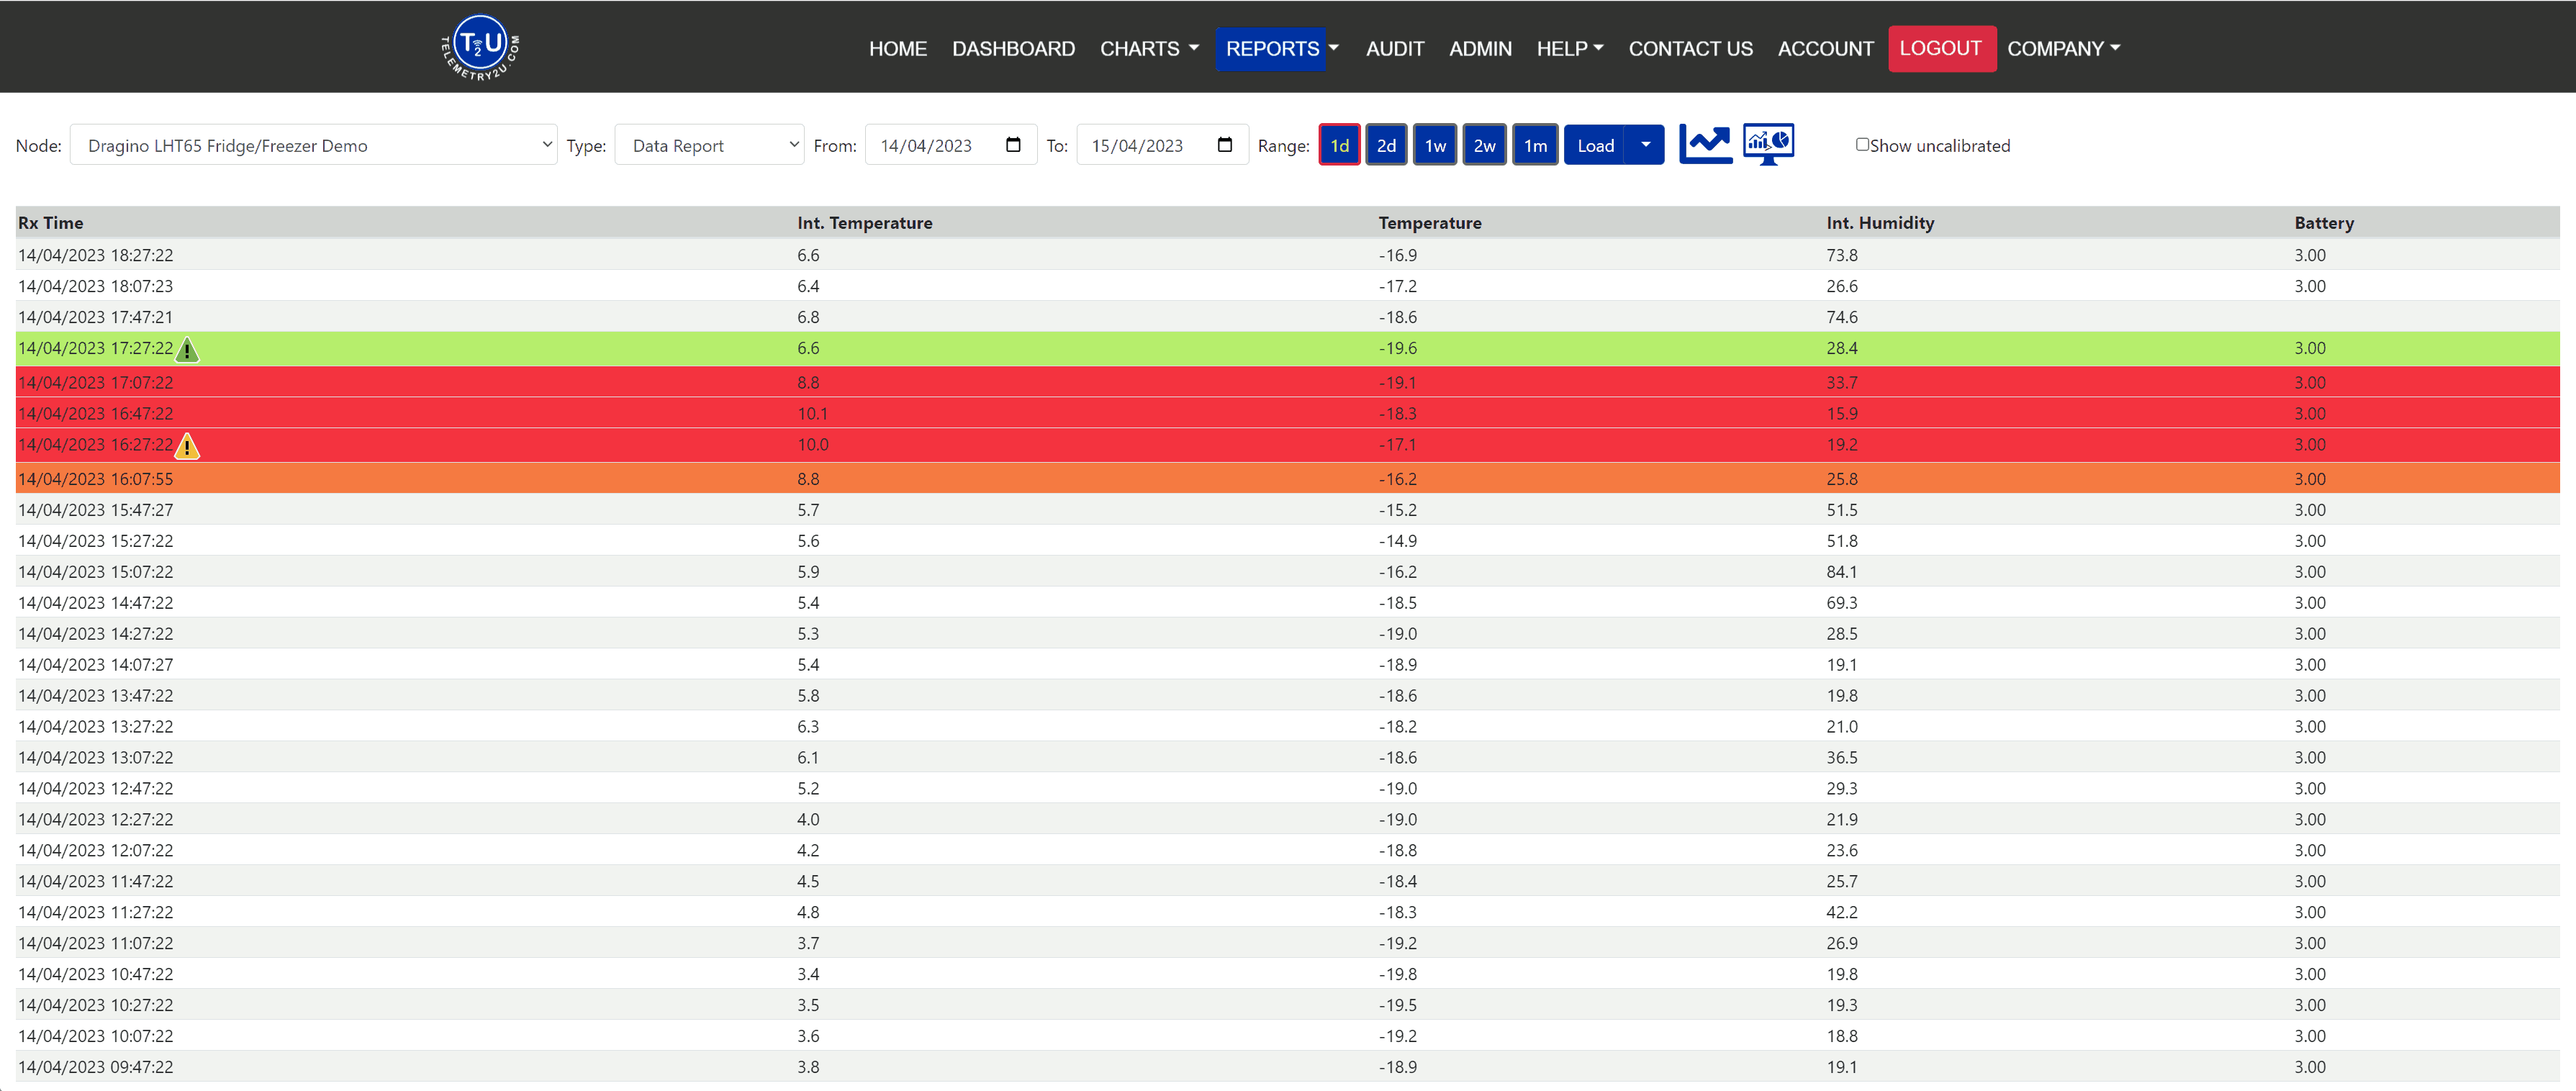
An orange background indicates a sensor input has exceeded its threshold, but hasn't yet met the required number of consecutive readings to trigger a notification.
A red background indicates that a sensor has remained in an alert state long enough to meet the Consecutive Readings threshold, and notifications have been sent.
A green background indicates that the sensor has returned to a normal state after being in an alert condition.
Users with the Add Annotations role enabled under their User Access settings will also see annotation icons appear beside any alert event on the Reports page. Clicking one of these icons opens a new window where an annotation can be added.

The yellow warning icon appears on red background rows and indicates an active sensor alert. Click this icon to add an annotation explaining the event.

The green warning icon appears on green background rows and indicates the sensor has recovered. Click this icon to leave a recovery annotation.
When the annotation window opens, you'll see the timestamp of the alert and a summary of notifications sent. Enter the relevant information in the Annotation field and click Save.
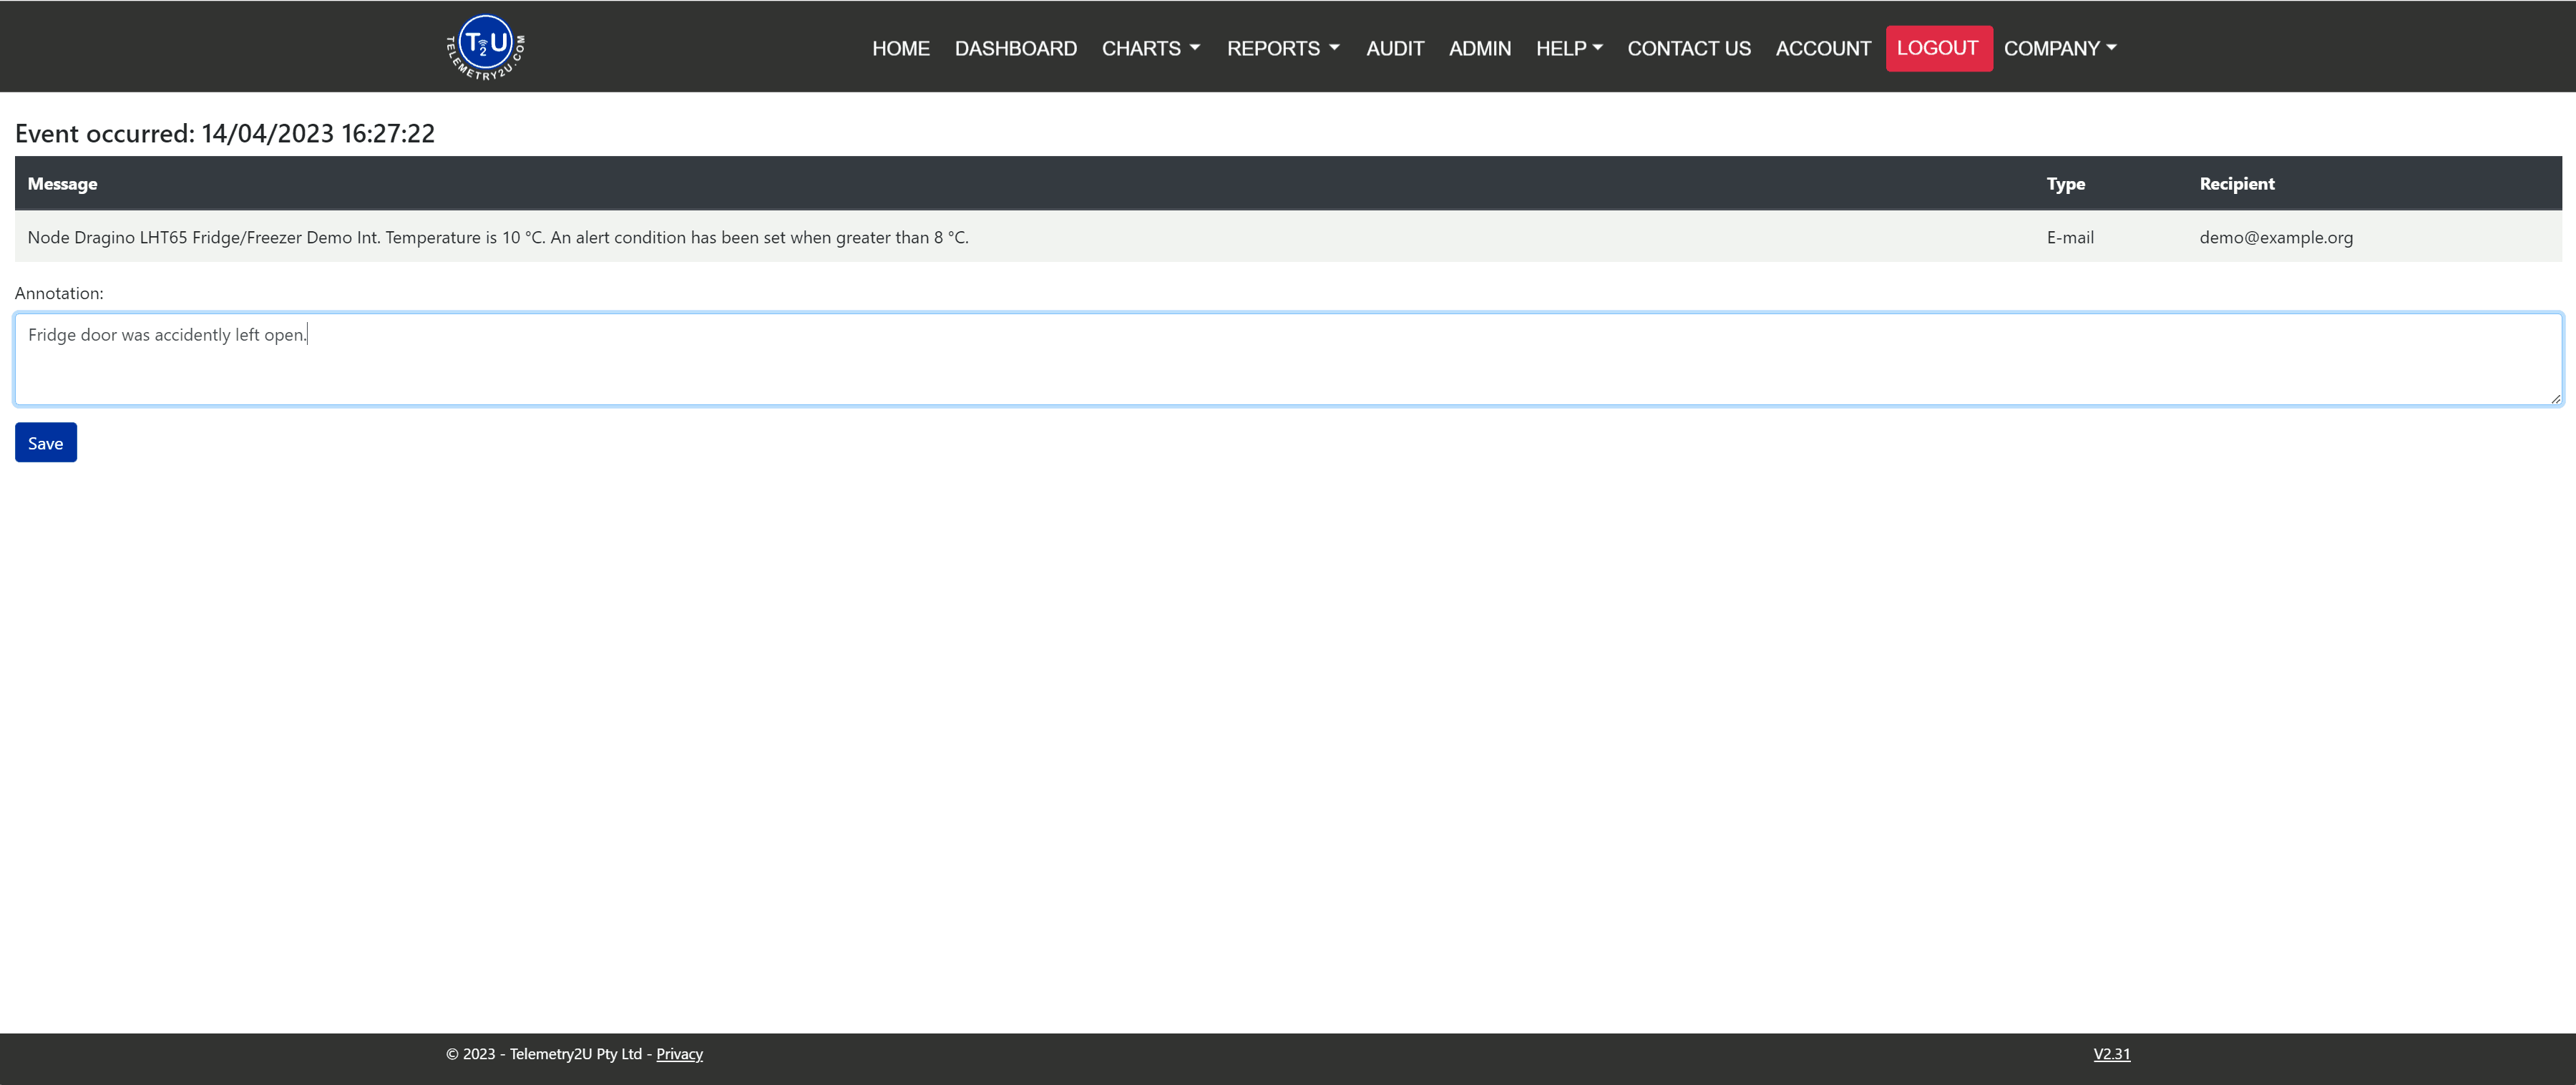

Once an annotation is saved, the warning icon is replaced with a pin-board icon, indicating that the alert event has been annotated. Click the pin icon to edit or delete the annotation as needed.
How to View Alert Annotations in Telemetry2U Audit Reports
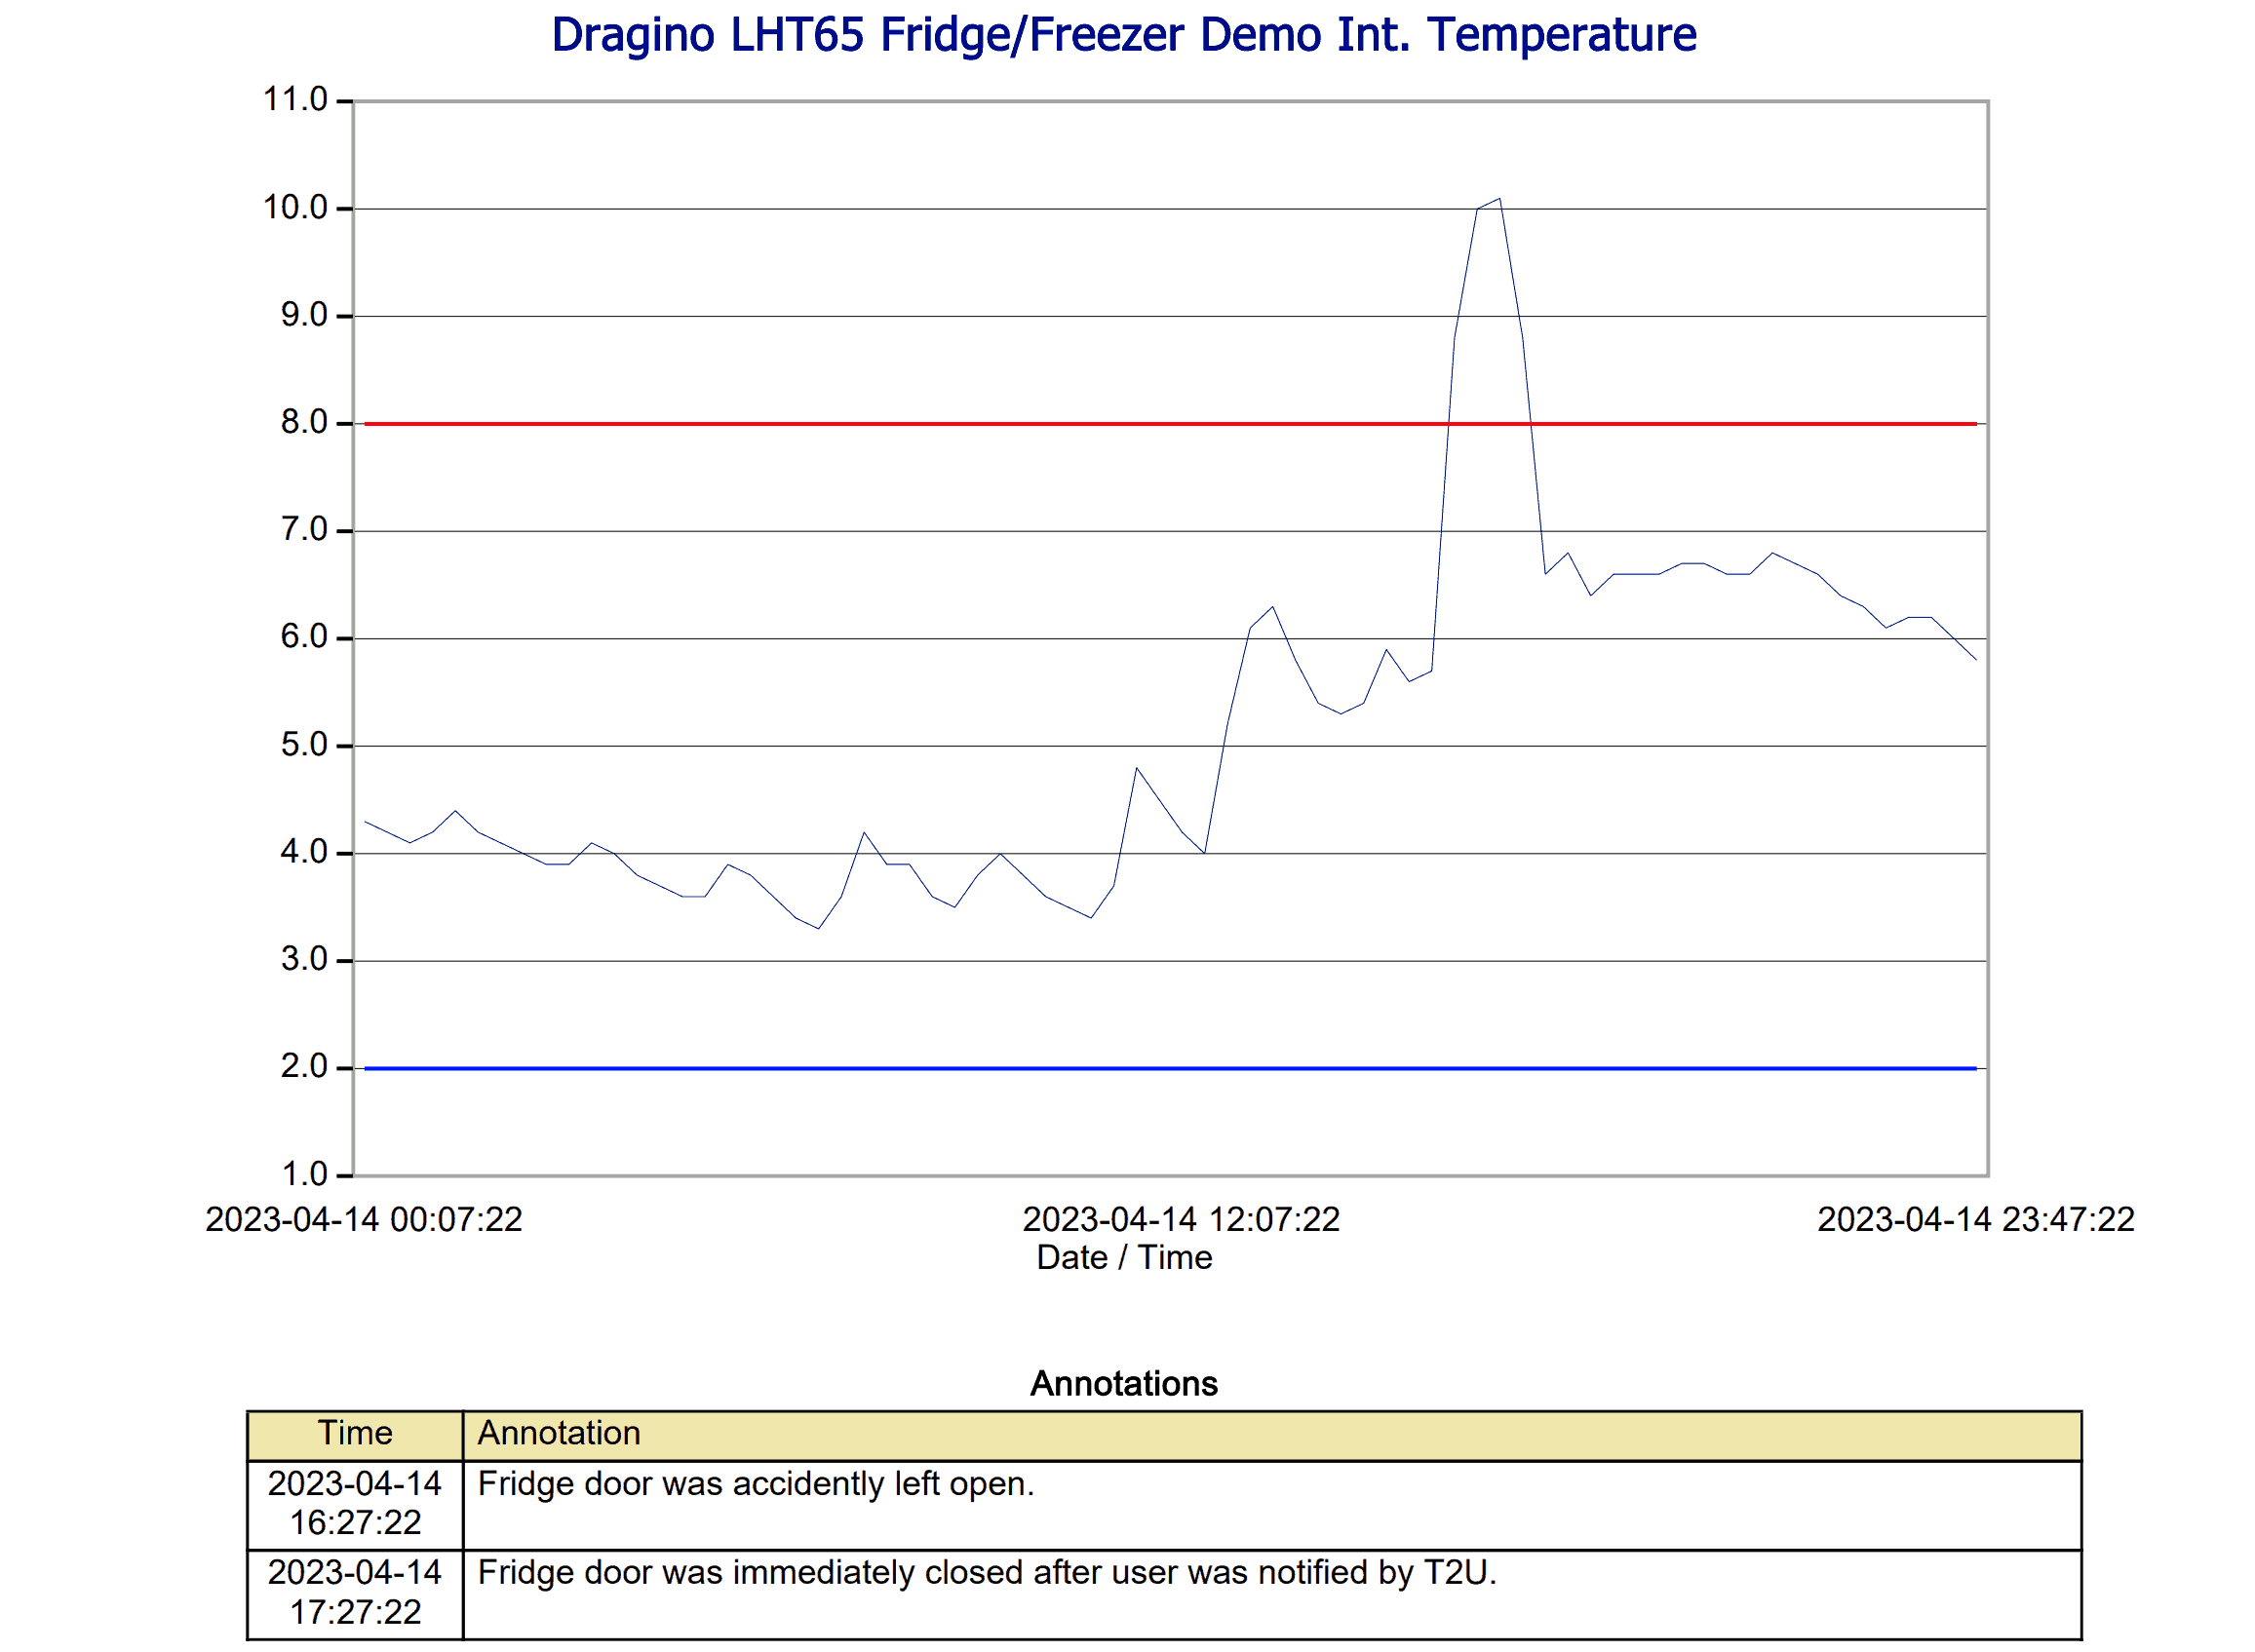
The most effective way to review all annotations for a specific node is through an Audit Report. If the report is configured to Include Annotations, a chronological list of all annotation entries will appear below the chart for that node.
Note:
Audit Reports can only be edited by users who have been assigned the Audit Admin role in their User Access settings.
For detailed instructions on creating and customising audit reports, refer to Section 5.0 – Audit Reports in our documentation.
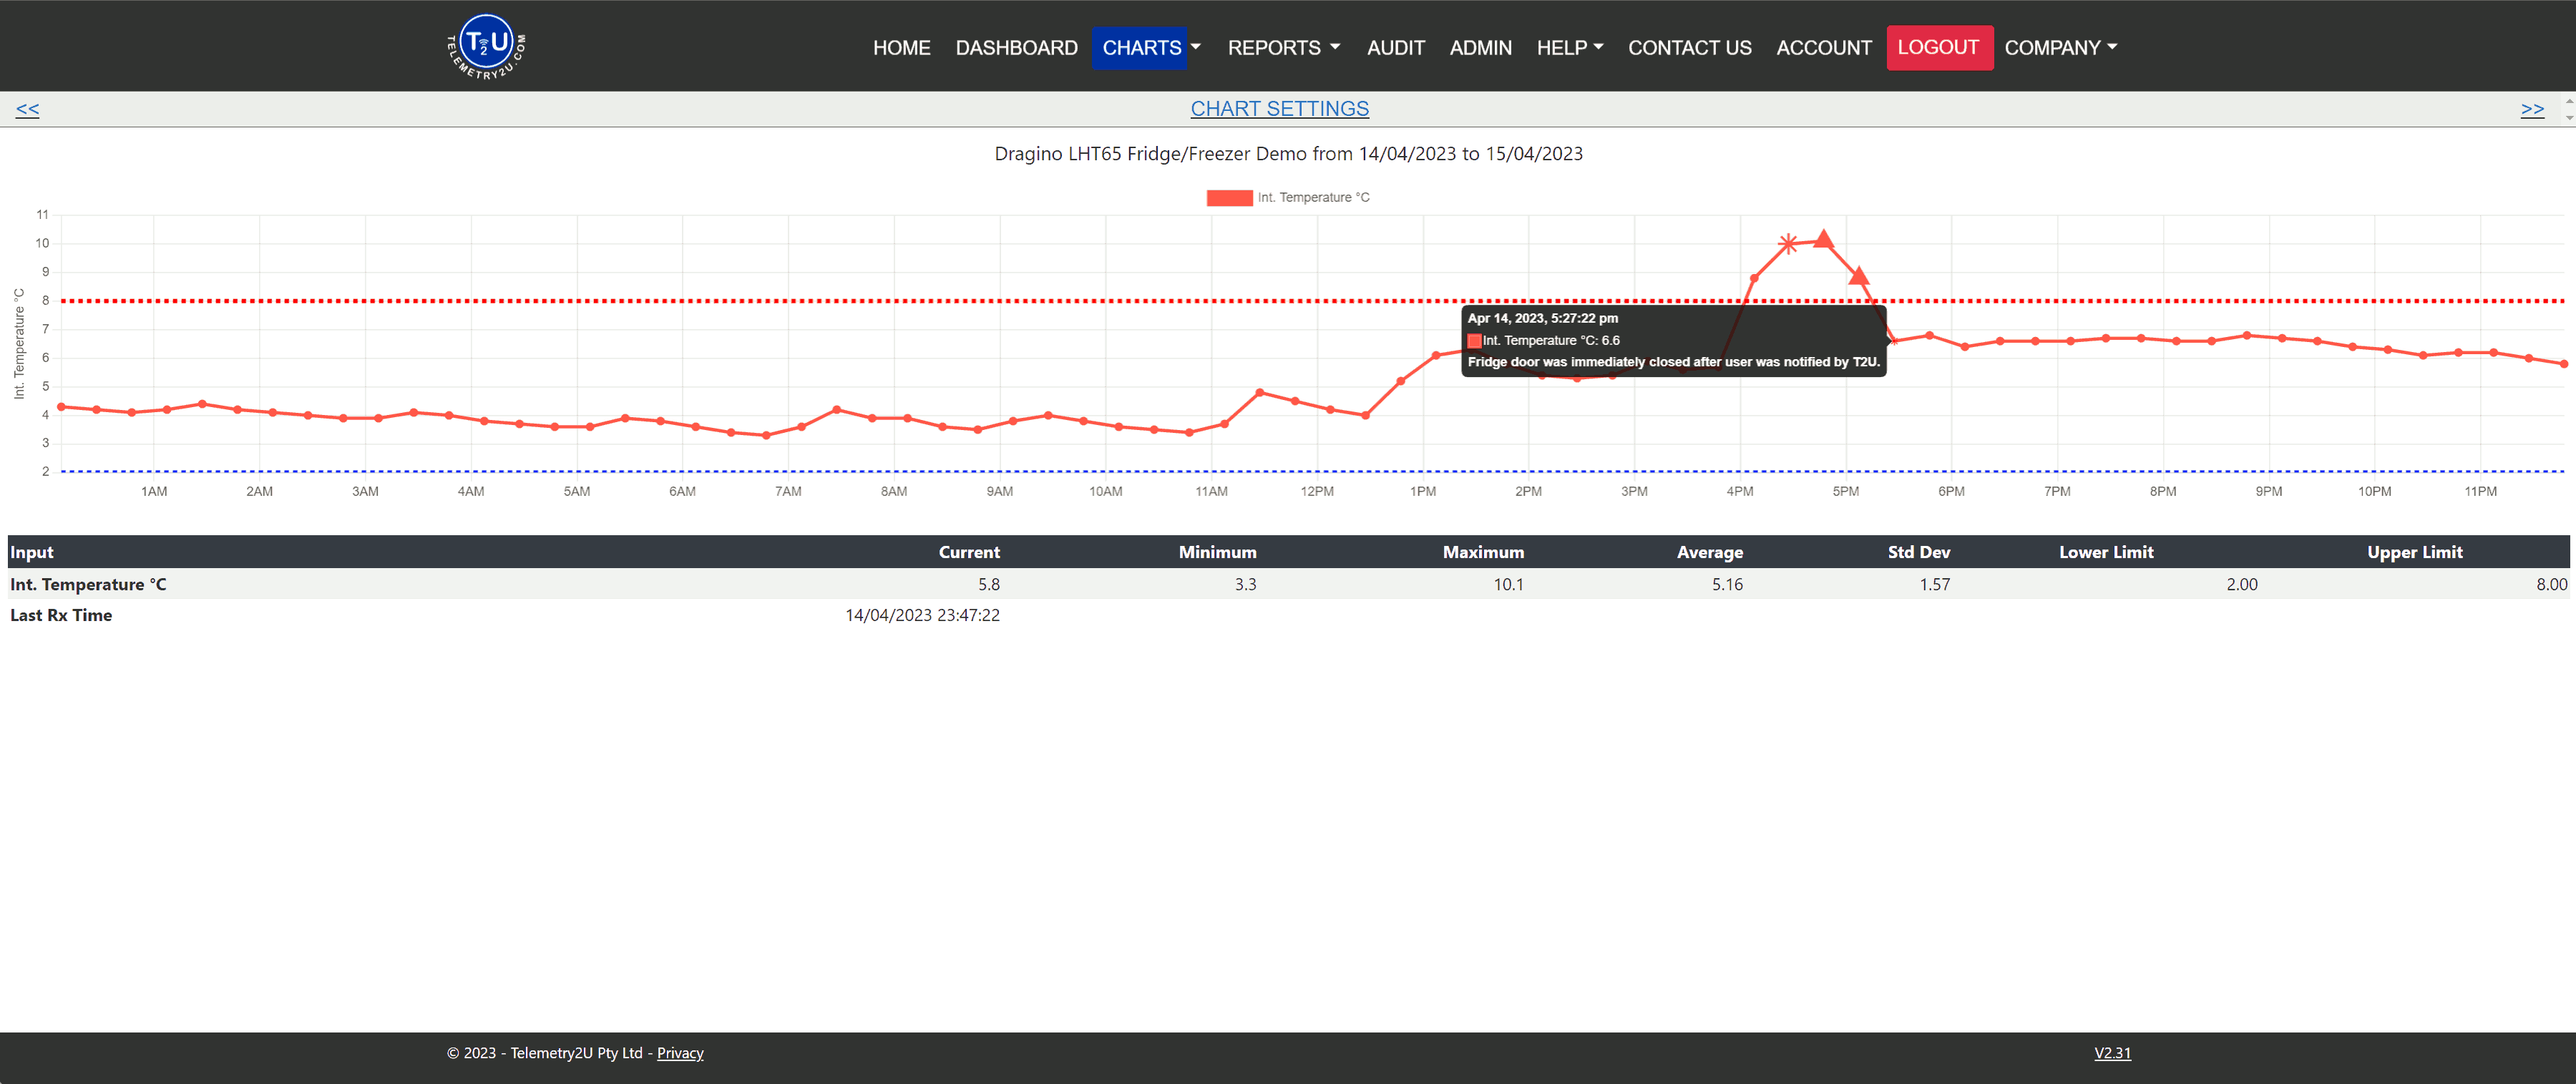
How to View Annotations on the Charts Page
In addition to audit reports, users can also view annotations directly on the Charts page. Simply hover over the asterisk (*) icon on the graph to display the associated annotation details.