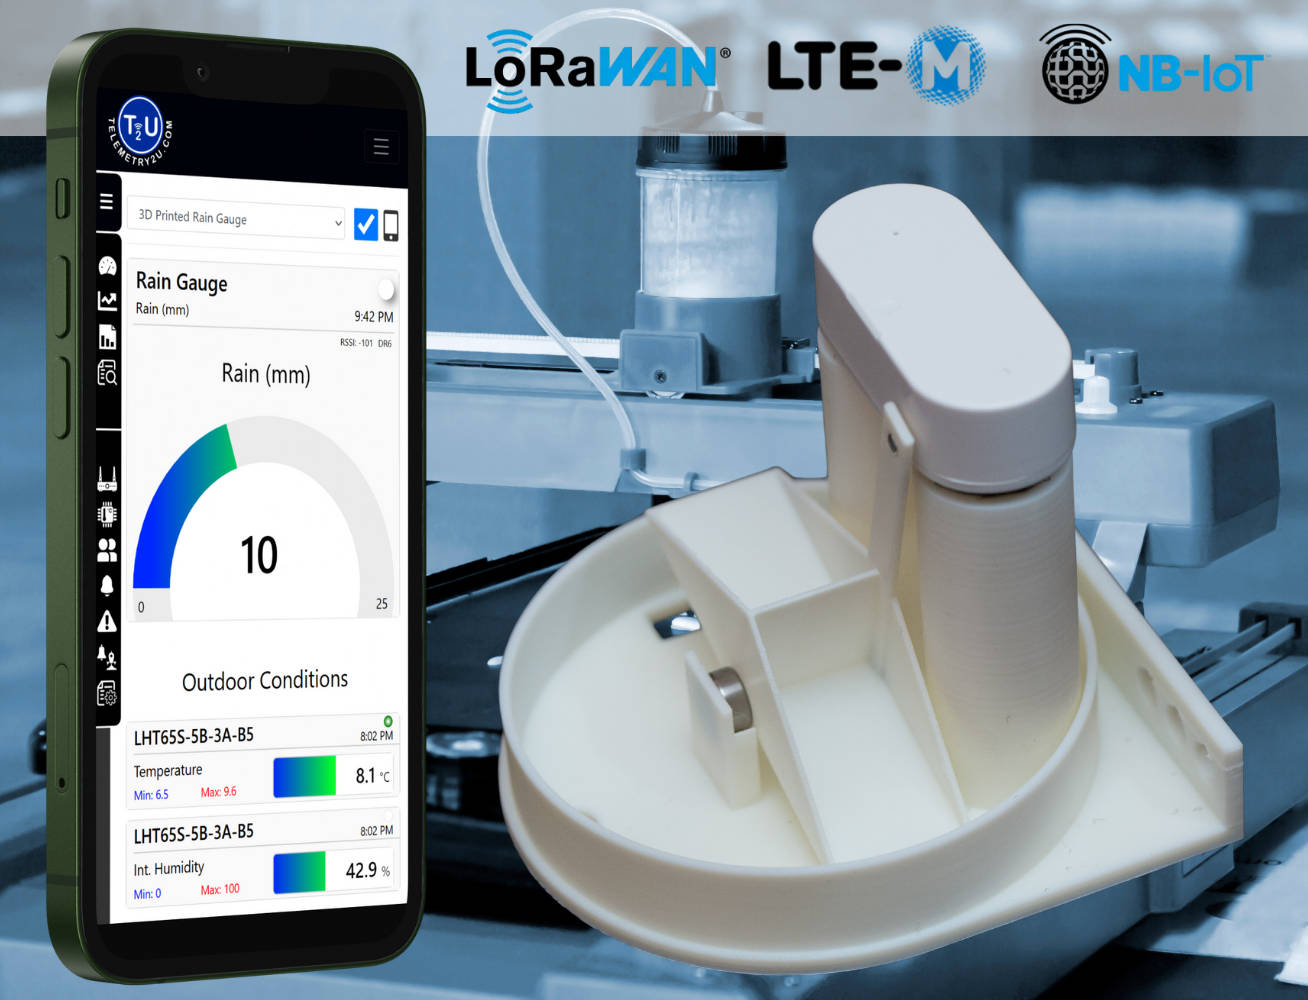
3D Printed Rain Gauge for IoT Networks: LoRaWAN, NB-IoT & LTE-M
Get accurate, real-time rainfall data with a 3D printed rain gauge integrated into the Telemetry2U IoT platform. Designed for use across LoRaWAN, NB-IoT, and LTE-M networks, this low-cost solution is ideal for smart agriculture, environmental research, and remote weather stations. Whether you're building your own sensor using open-source designs or purchasing a preconfigured kit, Telemetry2U enables seamless data logging, dashboards, and alerts — anywhere, anytime.
Rainfall Data, Alerts and Dashboards with Telemetry2U
When connected to the Telemetry2U platform, your 3D printed rain gauge becomes part of a powerful IoT monitoring system. Data from every tipping event is timestamped, converted to rainfall totals, and visualised through fully customisable dashboards. Users can view live and historical rainfall trends, set up real-time alerts, and even trigger automated actions based on specific thresholds.
Real-Time Rainfall Features:
- Real-Time Data Logging – See rainfall events as they happen, with timestamped records.
- Period Statistics Page – View daily, weekly, or monthly totals in chart and table formats.
- Custom Dashboards – Create charts, tables, and gauges to display live and total rainfall.
- Integrated Weather Monitoring – Add other sensors and see all your data in one place.
- Alerts via Email, SMS & Voice – Get notified instantly when rainfall crosses set thresholds.
- Smart Device Automation – Trigger pumps, valves, or alerts based on rainfall levels.
- Data Export & Reports – Download rainfall history in CSV format for analysis or compliance.
- API Integration – Access live and historical data via a secure API.
- Multi-Network Connectivity – Works seamlessly over LoRaWAN, NB-IoT, or LTE-M networks.
- Offline Buffering – Store data locally and sync once connectivity is restored.
- Device Health Monitoring – Track battery level and signal strength remotely.
Flexible Rain Gauge Integration with LoRaWAN, NB-IoT & LTE-M
Your 3D printed rain gauge can be easily connected to the Telemetry2U platform using a range of wireless communication methods. Whether you're deploying on a community LoRaWAN network, or using NB-IoT or LTE-M, we offer solutions that ensure reliable, long-range, and low-power performance.
Multiple Connectivity Options
- LDS02-Compatible Model – Designed to fit a Dragino LDS02 LoRaWAN door sensor, this version uses the internal magnetic reed switch in the LDS02 to detect each bucket tip. It’s a simple, wireless option that offers seamless integration with the Telemetry2U platform over LoRaWAN.
- Universal Reed Switch Model – This version includes a mounting point for a standard reed switch that closes briefly with each tip. It can be connected to any LoRaWAN, NB-IoT, or LTE-M device that supports digital input, making it ideal for custom integrations.
Each setup supports reliable data transmission, remote access, and full use of Telemetry2U’s dashboards, alerts, and automation features — no matter which network you use.
3D Printed Rain Gauge Design for IoT Applications
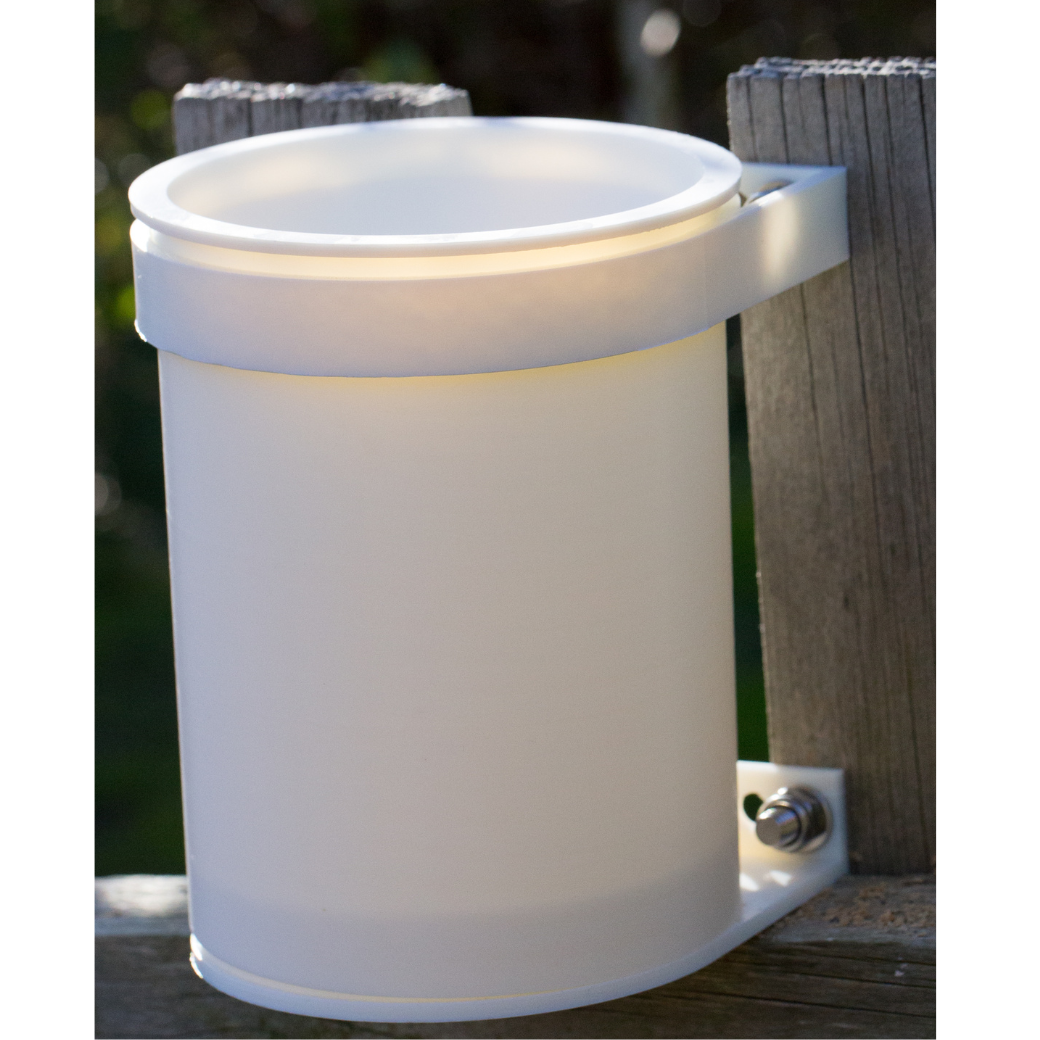
The 3D printed rain gauge is compact, durable, and designed for reliable long-term operation in outdoor environments. It uses a tipping bucket mechanism to accurately measure rainfall, with each tip detected by a magnetic reed switch. The housing is compatible with a range of IoT devices for flexible integration.
For best results, we recommend printing the rain gauge components using ASA filament. ASA offers excellent UV resistance, weather durability, and mechanical strength — making it more suitable for outdoor use than standard PLA or ABS. The tipping bucket is mounted on 624ZZ sealed bearings for smooth and consistent operation.
A 4×2mm disc magnet is mounted to the tipping arm and passes close to the reed switch with each tip, generating a clean digital pulse for accurate rainfall logging. The overall design is simple to print and assemble, with STL files available for both the LDS02-compatible and universal reed switch versions.
3D Printed Rain Gauge with Reed Switch Output
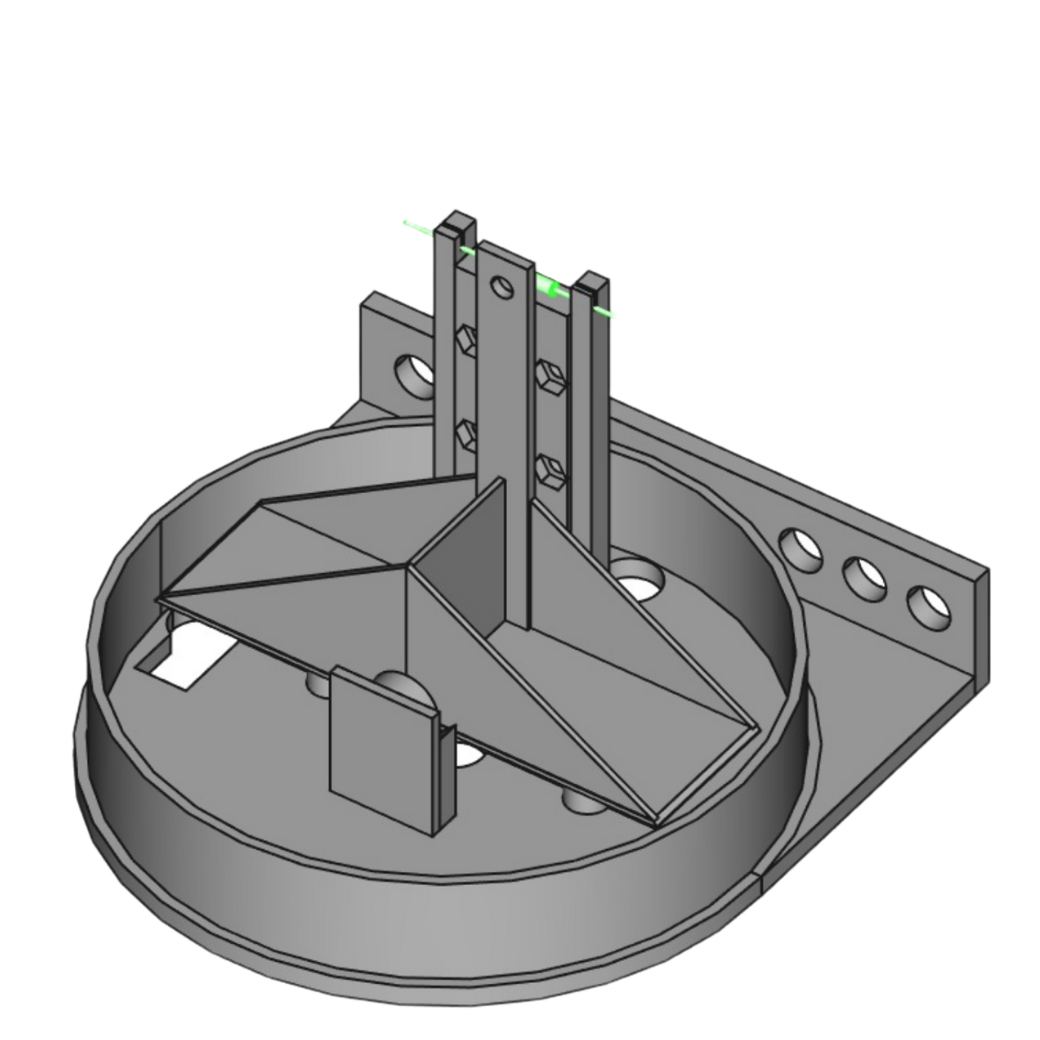
This version of the rain gauge is designed with a built-in mount for a standard magnetic reed switch. Each time the tipping bucket activates, the switch momentarily closes, creating a pulse that can be logged by any IoT device with a digital input.
This open-ended design is perfect for users integrating with LoRaWAN, NB-IoT, or LTE-M networks, or for those using traditional data loggers. It’s a flexible and budget-friendly option suitable for hobbyists, researchers, and commercial deployments alike.
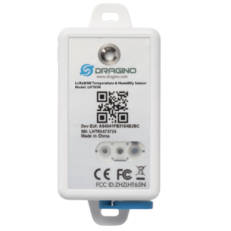
Add Temperature and Humidity to Rainfall
The Dragino LHT65N LoRaWAN sensor can be configured in pulse counter mode to capture rainfall data via the reed switch while simultaneously monitoring temperature and humidity. Many NB-IoT and LTE-M sensors with digital inputs also support this feature, enabling multi-parameter environmental tracking in a single device.
3D Printed Rain Gauge with Integrated LDS02 LoRaWAN Sensor
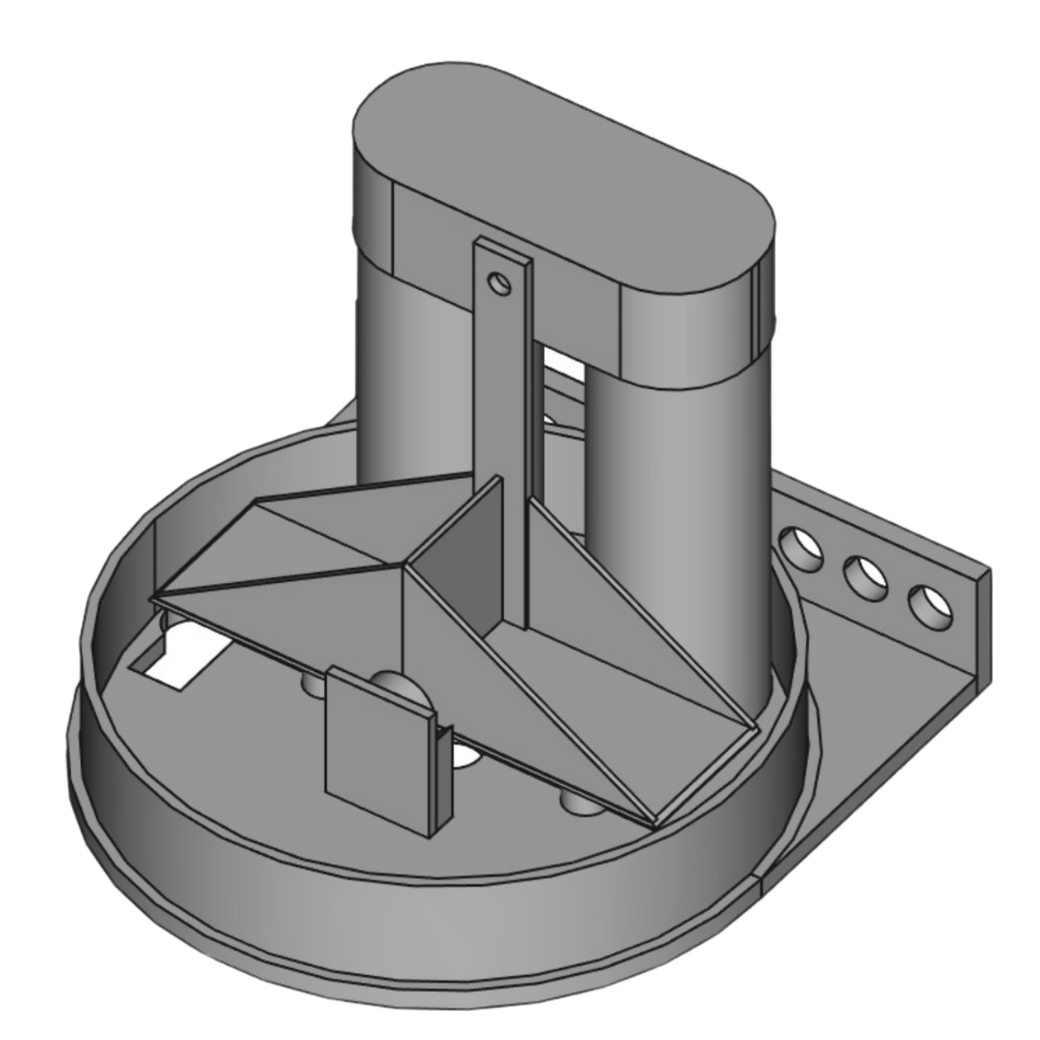
This model is purpose-built to house a Dragino LDS02 LoRaWAN door sensor, which detects each tip of the bucket using its internal magnetic reed switch. It delivers a completely wireless solution with no external wiring or soldering required.
The LDS02 version is ideal for fast deployment. Once assembled, it can be added to the Telemetry2U platform in just a few steps using our guided onboarding tools and payload decoder support.
Built-In LDS02 LoRaWAN Rain Gauge
The LDS02 model is LoRaWAN-only and has been specifically designed to suit the Dragino LDS02 sensor. The compact, sealed housing makes it easy to install, and it runs efficiently on two AAA batteries for long-term, low-maintenance operation.
How to Add Your Rain Gauge to the Telemetry2U Platform
This section explains how to add the LDS02-based rain gauge to the Telemetry2U platform. The setup process is quick and typically takes only a few minutes. While the example focuses on the Dragino LDS02 LoRaWAN sensor, the same steps apply to devices using NB-IoT or LTE-M connectivity.
Add a LoRaWAN 3D Printed Rain Gauge in a Few Simple Steps
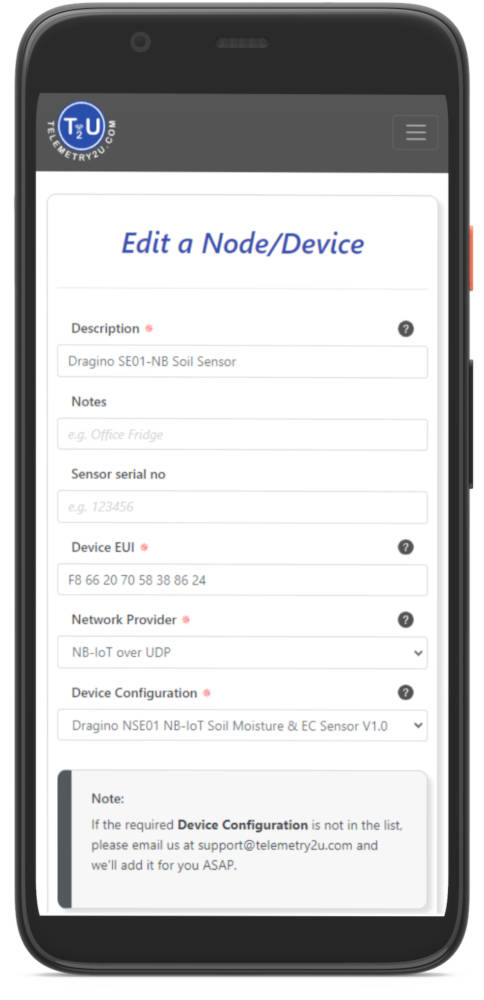
- Access Node Maintenance: Go to Admin >> Node Maintenance and click Add New Node.
- Select Network Provider: Choose the Network Provider appropriate for your end device.
- Pick the Device Configuration: Select LDS02 LoRaWAN Door Sensor V1.2 if using the LDS02-based Rain Gauge, or choose the appropriate decoder for your device.
- Name Your Device: Enter a custom name to help you identify the device later.
- Enter the Device Keys: For LoRaWAN devices, select the correct Frequency and Class, then input the DEUI and APPKEY as configured on your sensor.
Note:
This guide assumes you're using a LoRaWAN-based rain gauge, such as the LDS02 model. If you're using an NB-IoT or LTE-M device instead, make sure you select the correct Device Configuration and Network Provider during setup. Read more about adding devices to the Telemetry2U IoT Platform.
Easy-to-Build IoT Dashboards for Rainfall Monitoring
Telemetry2U makes it easy to build custom dashboards tailored to your monitoring needs. Whether you're tracking live rainfall, reviewing historical trends, or combining data from multiple sensors, the dashboard editor is flexible, user-friendly, and fully cloud-based. You can build charts, tables, gauges, and more — no coding required.
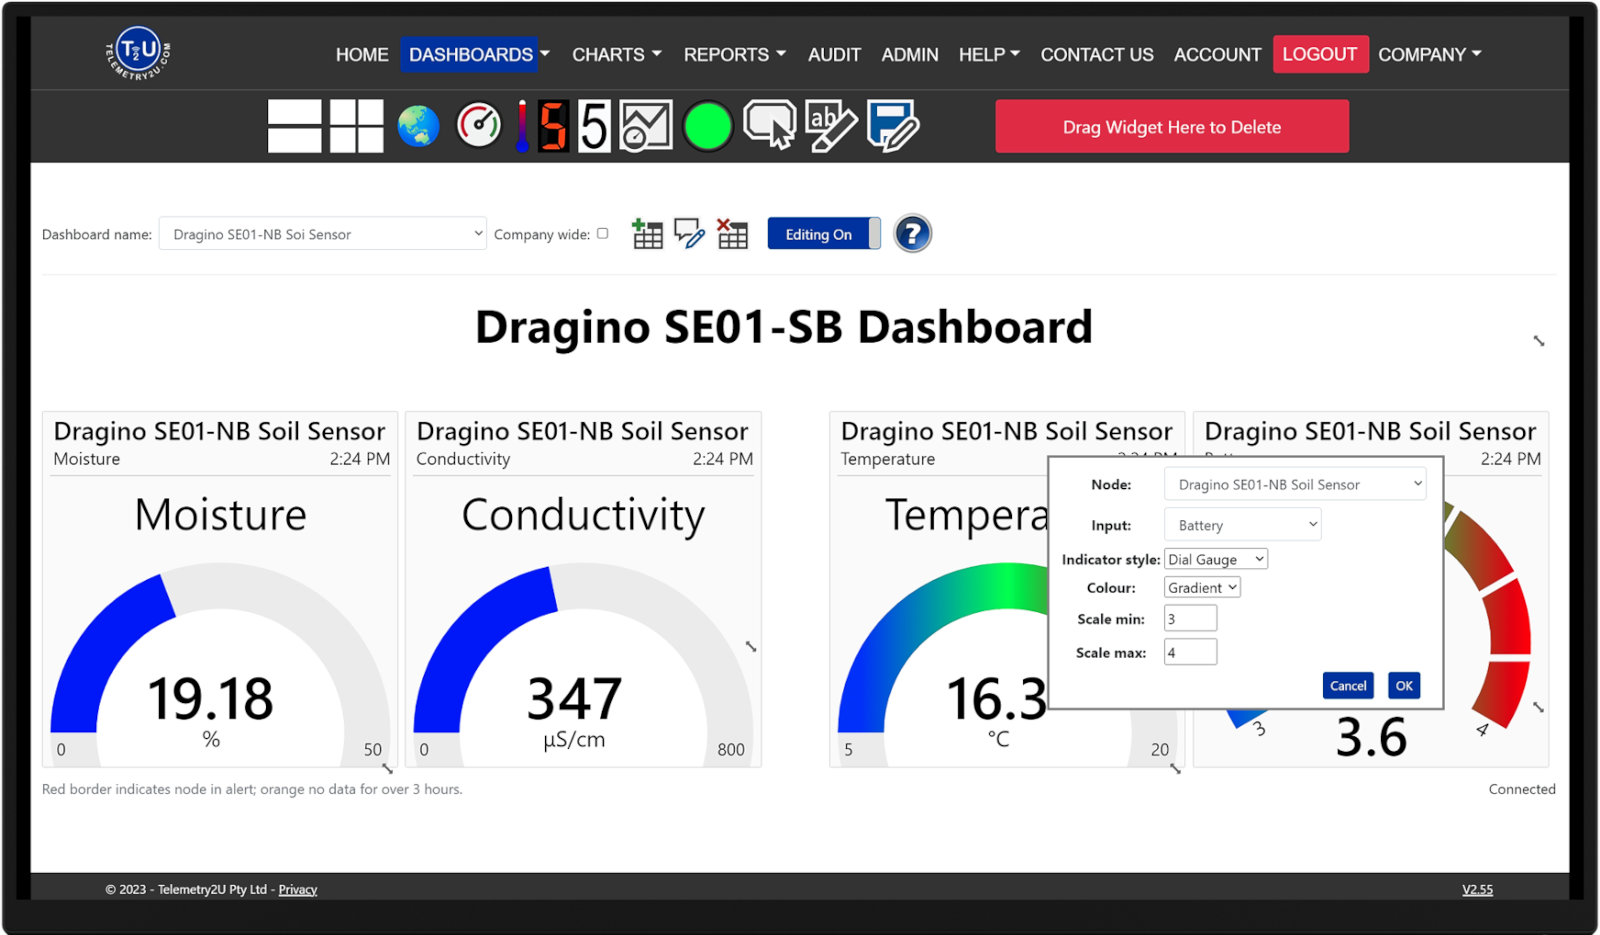
Create a Custom Dashboard
- Create a New Dashboard: Go to the Dashboards section and click Create New.
- Enable Edit Mode: Press the Editing button to unlock widget and layout tools.
- Add Widgets: Select and place your desired widgets, then resize them to fit your layout.
- Configure Widgets: Double-click each widget to assign it to a node, choose data inputs, customise appearance, and define data ranges.
- Save Your Dashboard: Once you're happy with the layout, click Save to apply your changes.
Note:
To make dashboards visible to your team, enable the Company Wide option or use Copy Dashboard in Admin settings to assign them individually.
On mobile devices, tick the Mobile View box to collapse widgets into a single column for easier viewing.
Learn more in the dashboard setup guide.
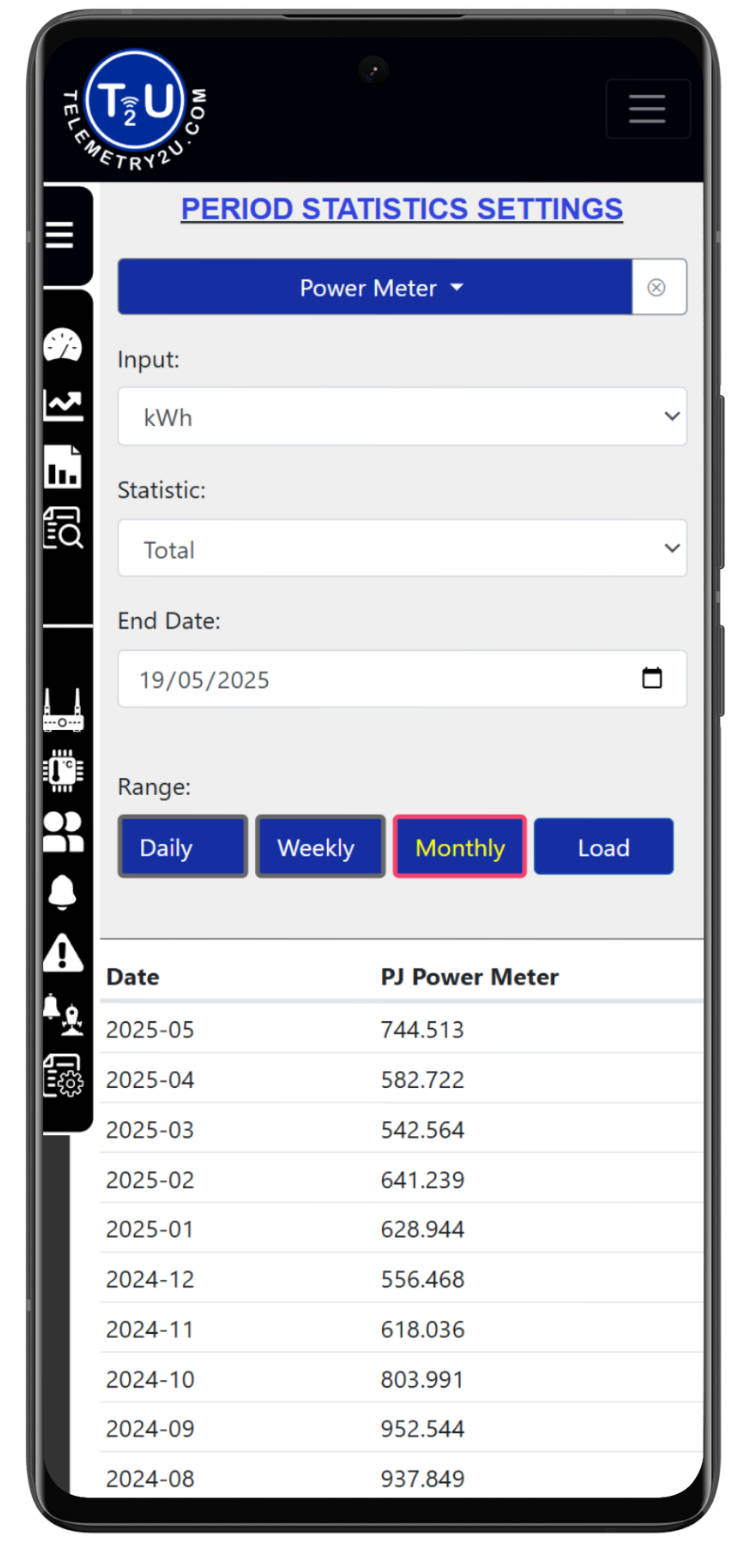
Daily, Weekly, and Monthly Rainfall Statistics
The Period Statistics page on Telemetry2U lets you analyse historical data across one or more devices from a single interface. You can compare rainfall readings over daily, weekly, or monthly timeframes — ideal for tracking total accumulated rainfall and identifying trends across different sites or sensors.
Easily Analyse and Compare Rainfall Data
In addition to totals, the platform automatically calculates minimum, maximum, average, and standard deviation values for each sensor, providing a complete view of environmental conditions. All data is displayed in both table and chart format, enabling quick interpretation and trend visualisation.
You can also export raw statistical data to CSV with a single click, making it easy to incorporate rainfall data into reports, spreadsheets, or external platforms for further analysis.
Whether you're comparing rainfall zones, meeting compliance requirements, or simply reviewing long-term performance, the Period Statistics tool turns sensor data into clear, actionable insights.