IoT Dashboards for Real-Time Sensor Monitoring
Telemetry2U IoT Dashboards allow you to visualise, monitor, and control sensor data in real time. Build fully custom dashboards using live widgets, charts, gauges, images, and embedded media — all responsive across desktop, tablet, and mobile.
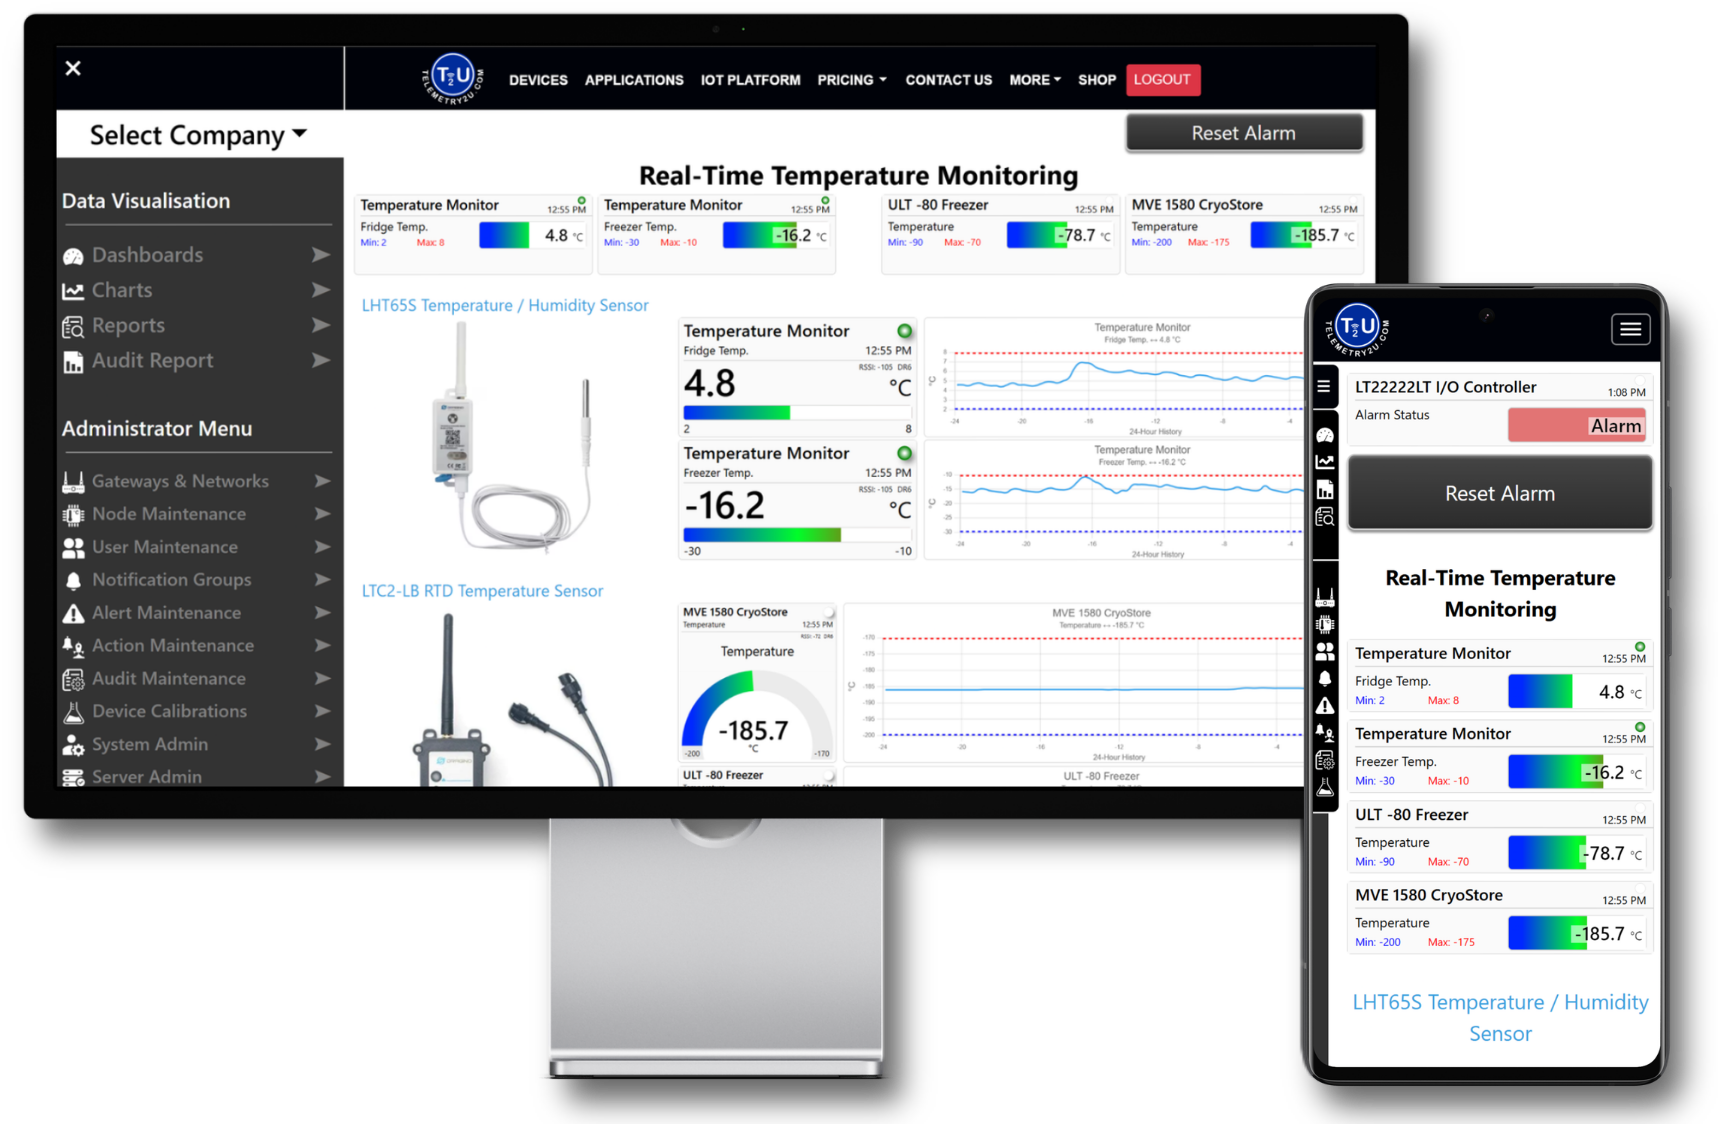
Monitor, Visualise, and Respond in Real Time
Telemetry2U dashboards give you complete visibility across all connected devices. Monitor any connected wireless sensor, organise data your way, and respond instantly from anywhere with an internet connection.
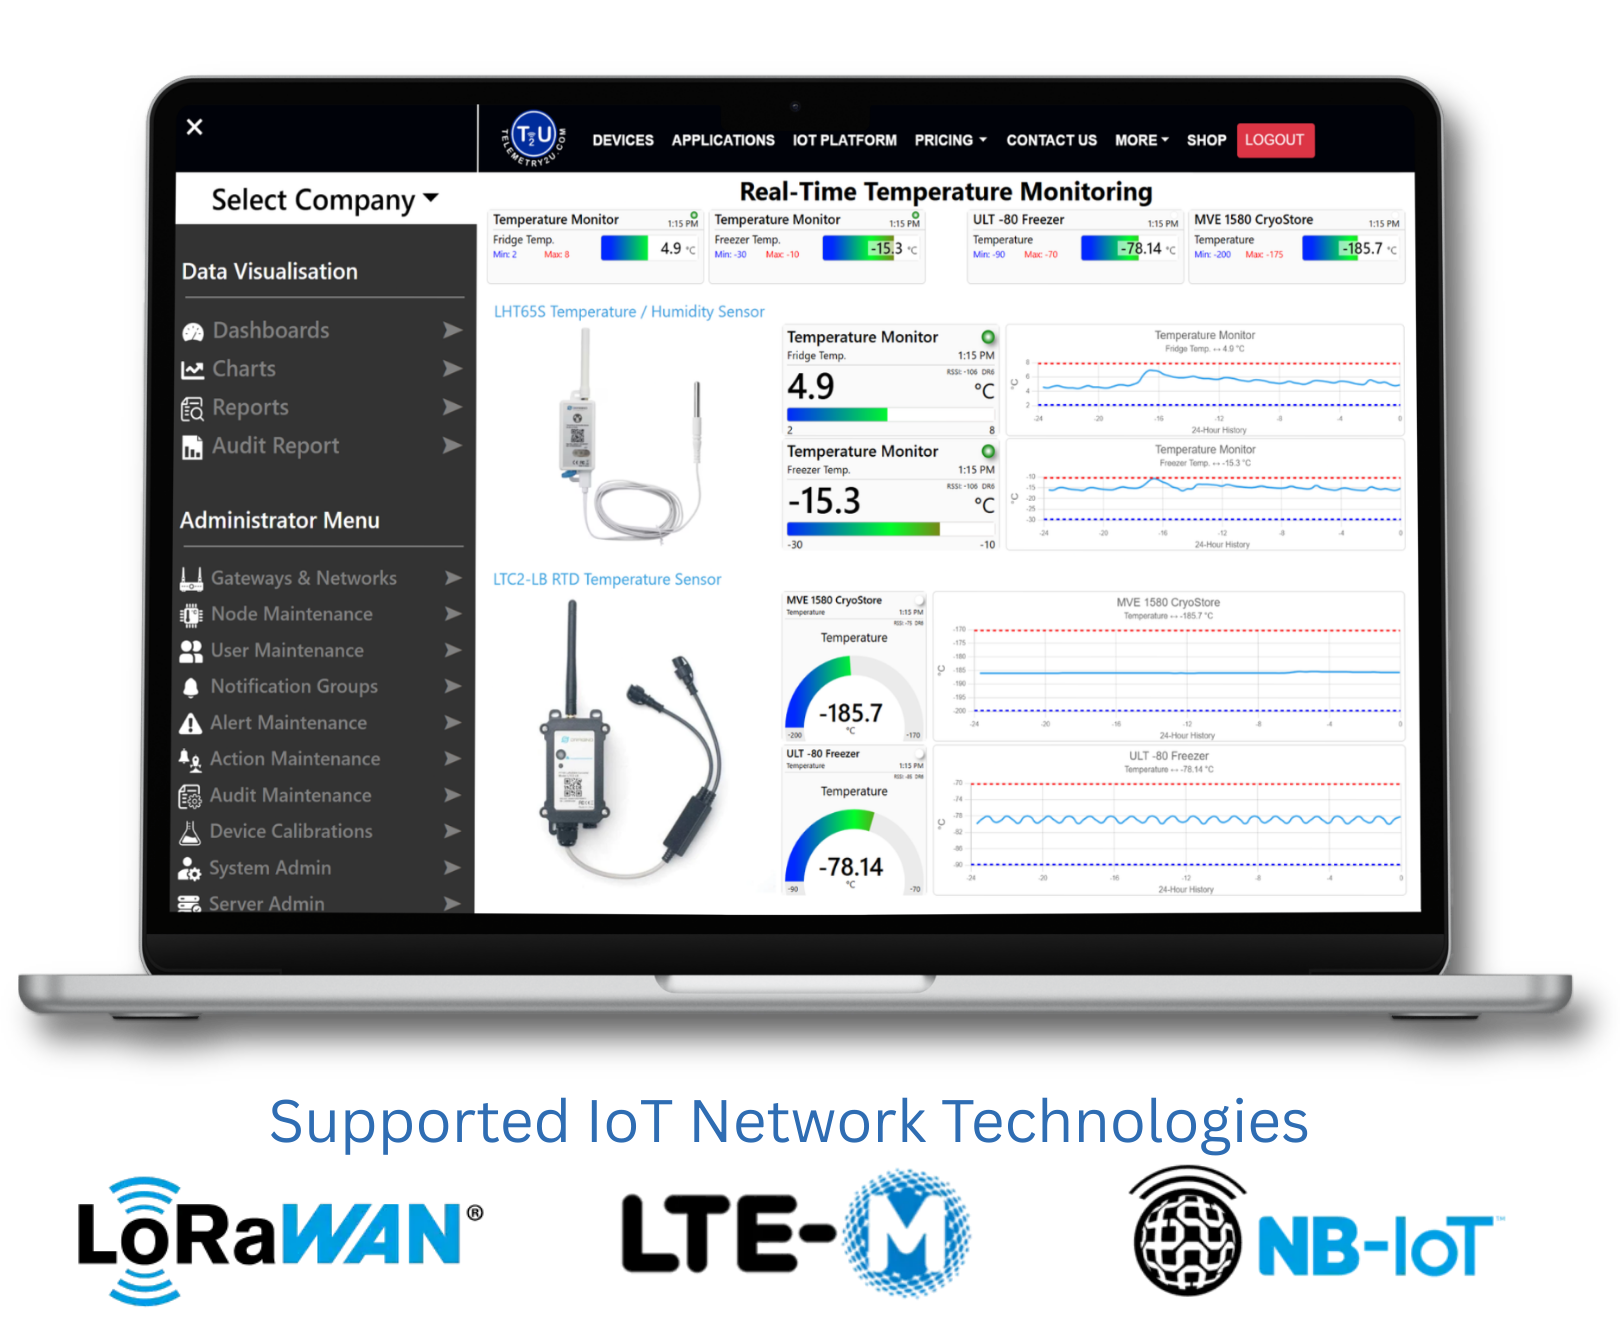
Unified Monitoring Across Devices and Locations
Telemetry2U consolidates data from any connected wireless sensor into one unified monitoring environment. Track devices across locations, compare performance, and maintain complete operational visibility without complexity.
Multi-Device Aggregation
Combine data from multiple sensors into a single structured view for simplified system monitoring.
Cross-Location Visibility
Monitor devices across rooms, facilities, or regions without switching between separate dashboards..
Trends & Comparison
Review historical performance data to identify patterns, compare devices, and support informed decisions.
Need Step-by-Step Instructions
Explore our detailed how-to-guide and full user manual for comprrehensive, step-by-step instructions and documentation to help you master Telemetry2U.