IoT Data Tables for Device-Level Insight
Review structured data tables across all connected devices and wireless sensors within the Telemetry2U IoT platform. Quickly assess account-wide sensor values, inspect detailed transmissions, and generate statistical summaries when required.
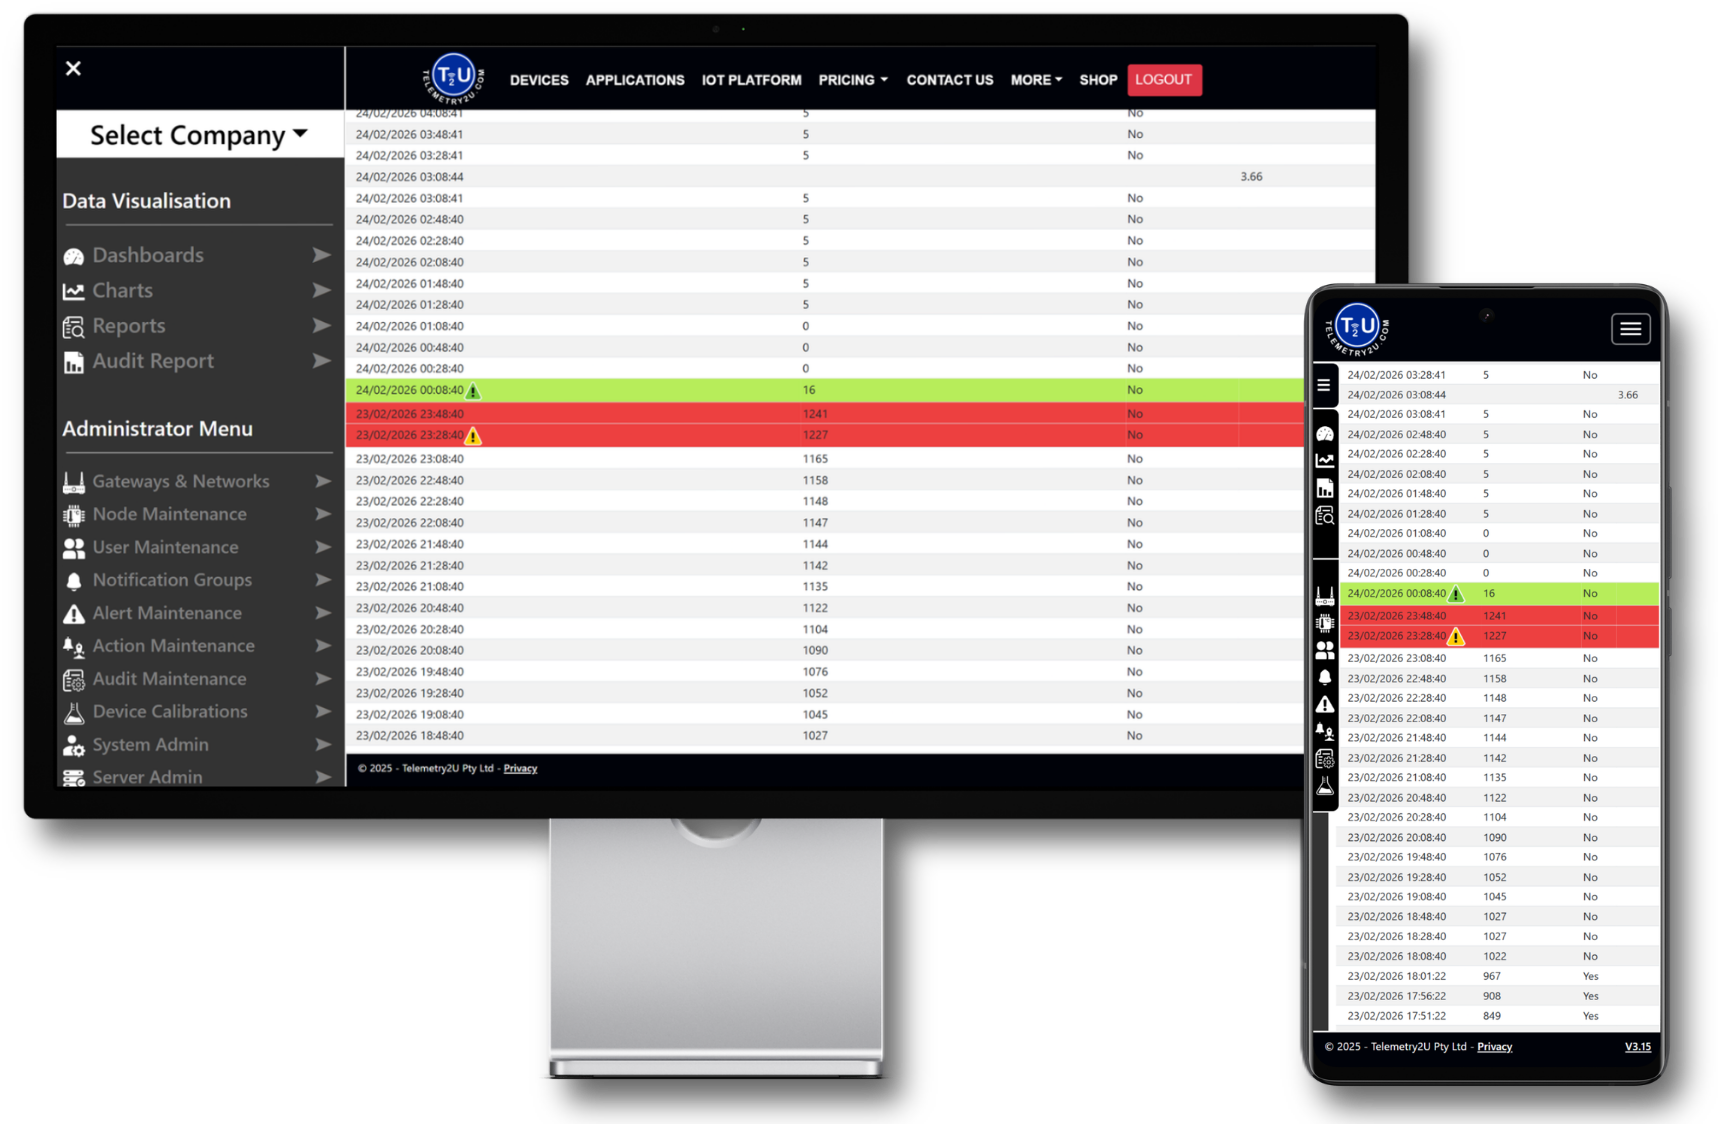
From Snapshot Review to Statistical Analysis
Begin with a clean, account-wide data snapshot, then move into detailed inspection of individual device activity. When required, generate statistical summaries across selected inputs and time ranges.
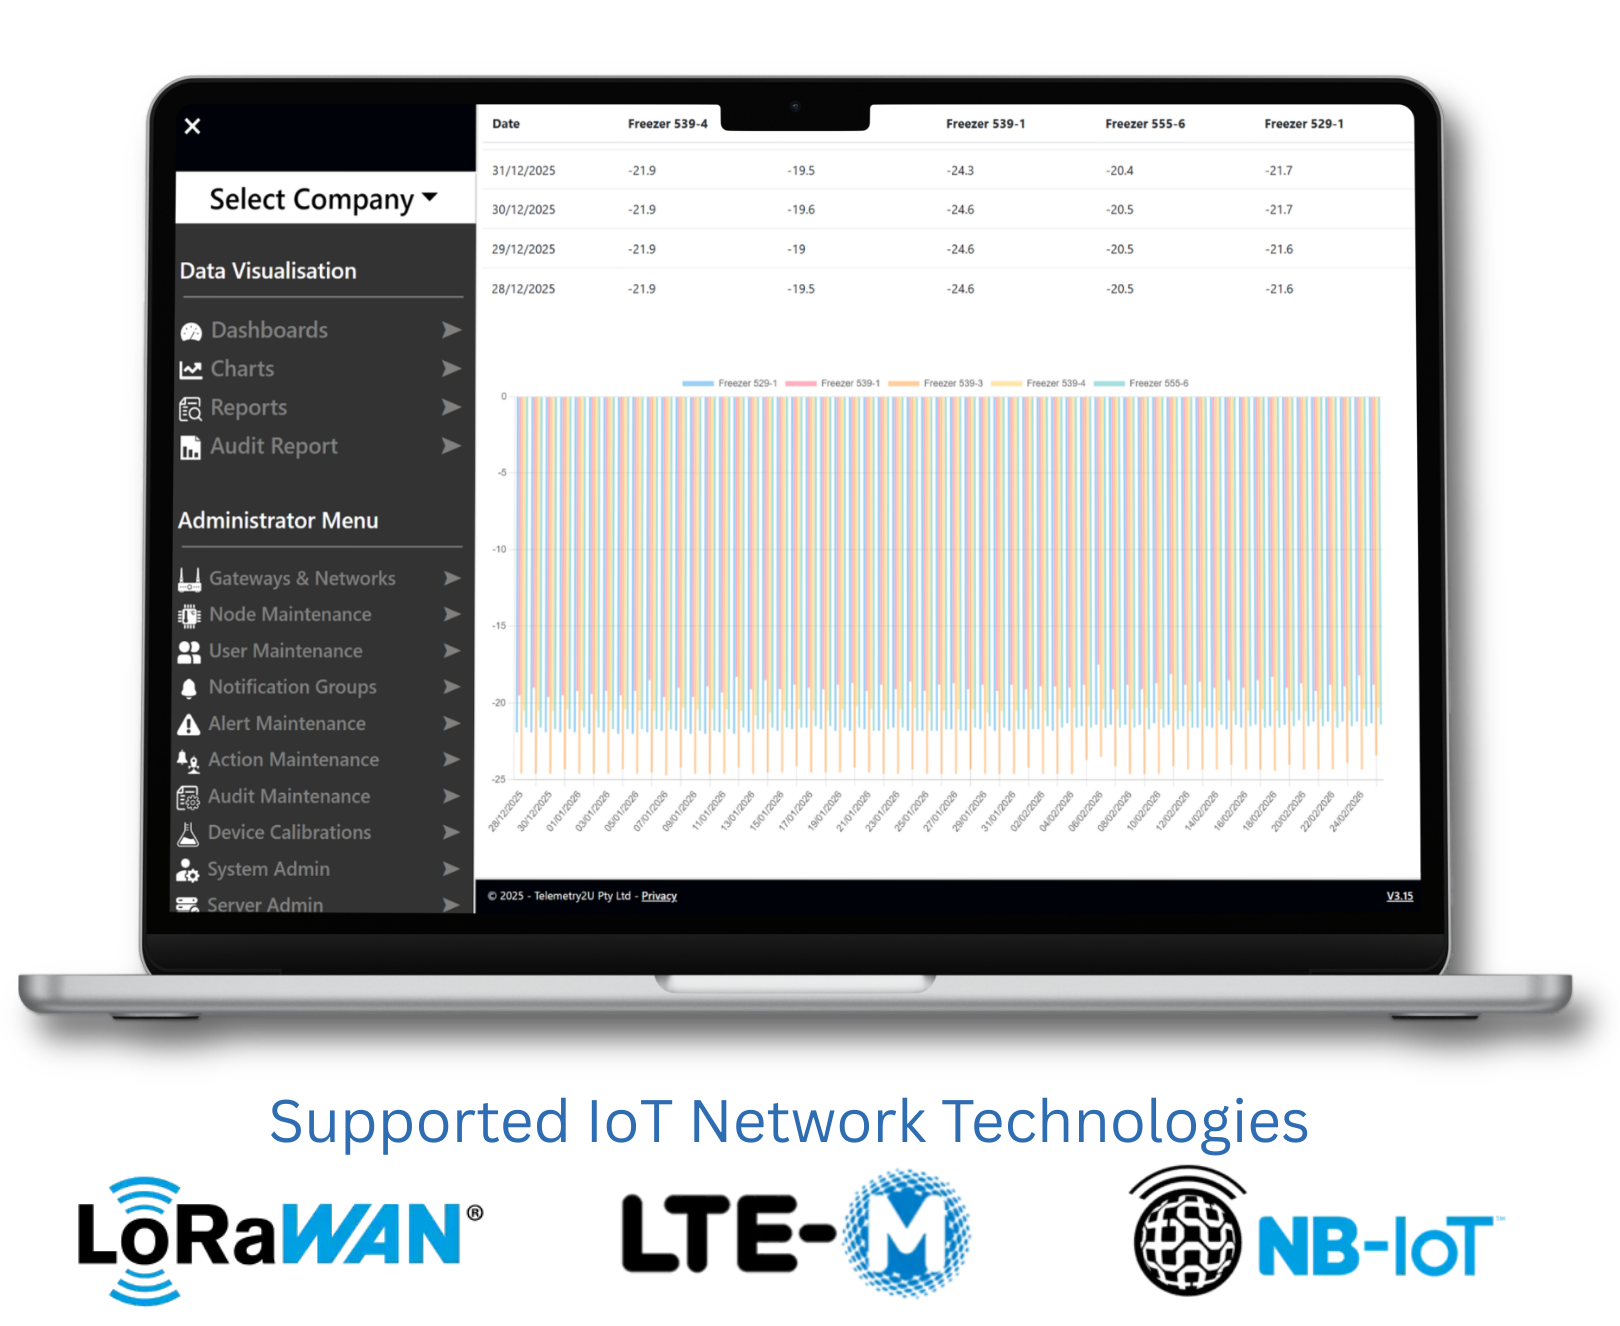
Structured Filtering and Cross-Platform Navigation
The Telemetry2U IoT platform consolidates device reporting across LoRaWAN, LTE-M, and NB-IoT networks into one unified interface. Filter by report type, adjust time ranges, navigate between dashboards and charts, and export structured data for operational or compliance review.
Flexible Date Control
Select preset time windows or define custom ranges, with quick forward and backward navigation across reporting periods.
Multi-Node Aggregation
Compare shared sensor inputs across multiple devices within a single structured data table.
Export and Integration
Download data in Excel, CSV, or PDF format for compliance, auditing, or further analysis.
Need Step-by-Step Setup Guidance?
Follow the structured setup guide to configure data tables, statistical reports, and export options within your Telemetry2U IoT platform account.