Connect Telemetry2U to the Helium Network on AU915
Configure a Dragino LHT65 for AU915 sub-band 2, register it in Telemetry2U and the hosted Helium Console, create the HTTP integration and confirm that sensor data is reaching the Telemetry2U platform.
Prepare the Accounts, Device and Network Coverage
This procedure documents the hosted Helium Console workflow used by the existing Telemetry2U integration. It uses a Dragino LHT65 temperature and humidity sensor as the example, but the platform-registration and HTTP integration stages also apply to other compatible LoRaWAN devices.
Helium network-server options: Helium also supports managed and self-hosted LoRaWAN network servers. Those services use different onboarding and integration steps; refer to the current Helium network-server guidance when you are not using the hosted Helium Console.
Use an account with access to Admin > Node Maintenance and Admin > Setup Integration.
Sign in to the Helium Console organisation that will manage the device, integration and data flow.
The LHT65 example requires current firmware and a compatible USB-to-serial converter for terminal access.
Confirm that the installation location is within range of an active Helium IoT Hotspot using the current Helium coverage tools.
1. Configure the Dragino LHT65 for AU915 Sub-Band 2
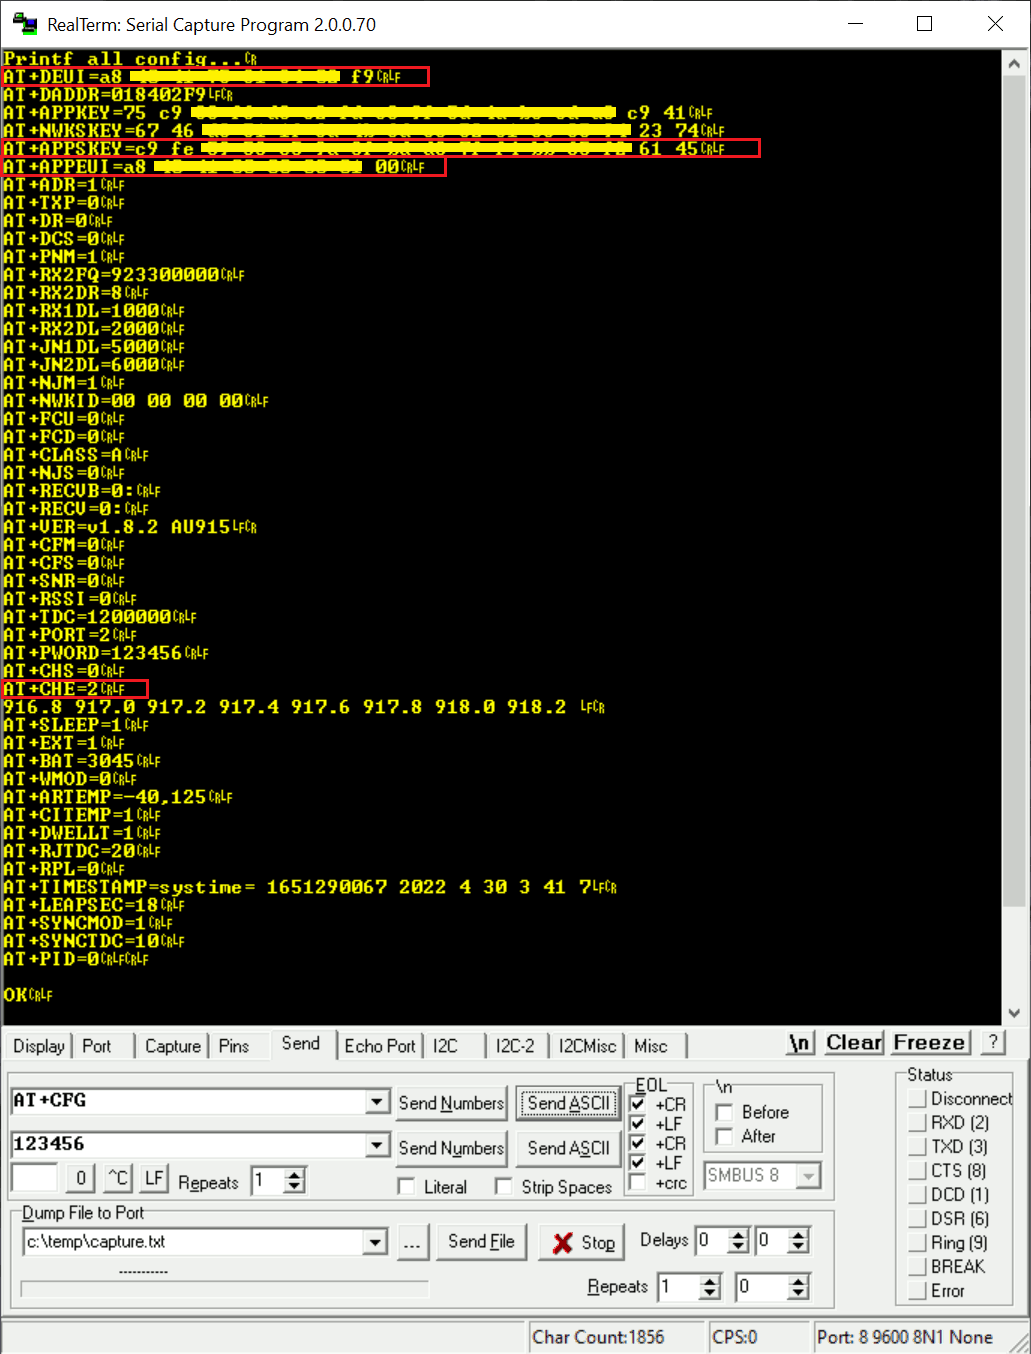
Connect the LHT65 to a computer and open a serial terminal such as RealTerm or PuTTY. The example device communicates at 9600 baud.
- Connect the LHT65 through the USB-to-serial converter.
- Open a serial session at
9600baud. -
Send the password
123456to initialise the terminal session. - Review the current configuration with .
- Configure AU915 sub-band 2 with .
- Restart the device with or hold the device button for approximately five seconds when prompted.
- Run
AT+CFGagain and confirm that the channel setting has been retained.
Record the Device EUI (DevEUI), Application EUI (AppEUI) and Application Key (AppKey). Enter each value without spaces when registering the device in both systems. Newer LoRaWAN documentation may refer to the AppEUI as the JoinEUI.
Optional radio settings: Adaptive Data Rate (ADR) is enabled by default on the example configuration and confirmed messages are disabled. Change these only when the deployment requires different behaviour.
2. Register the Device in Telemetry2U
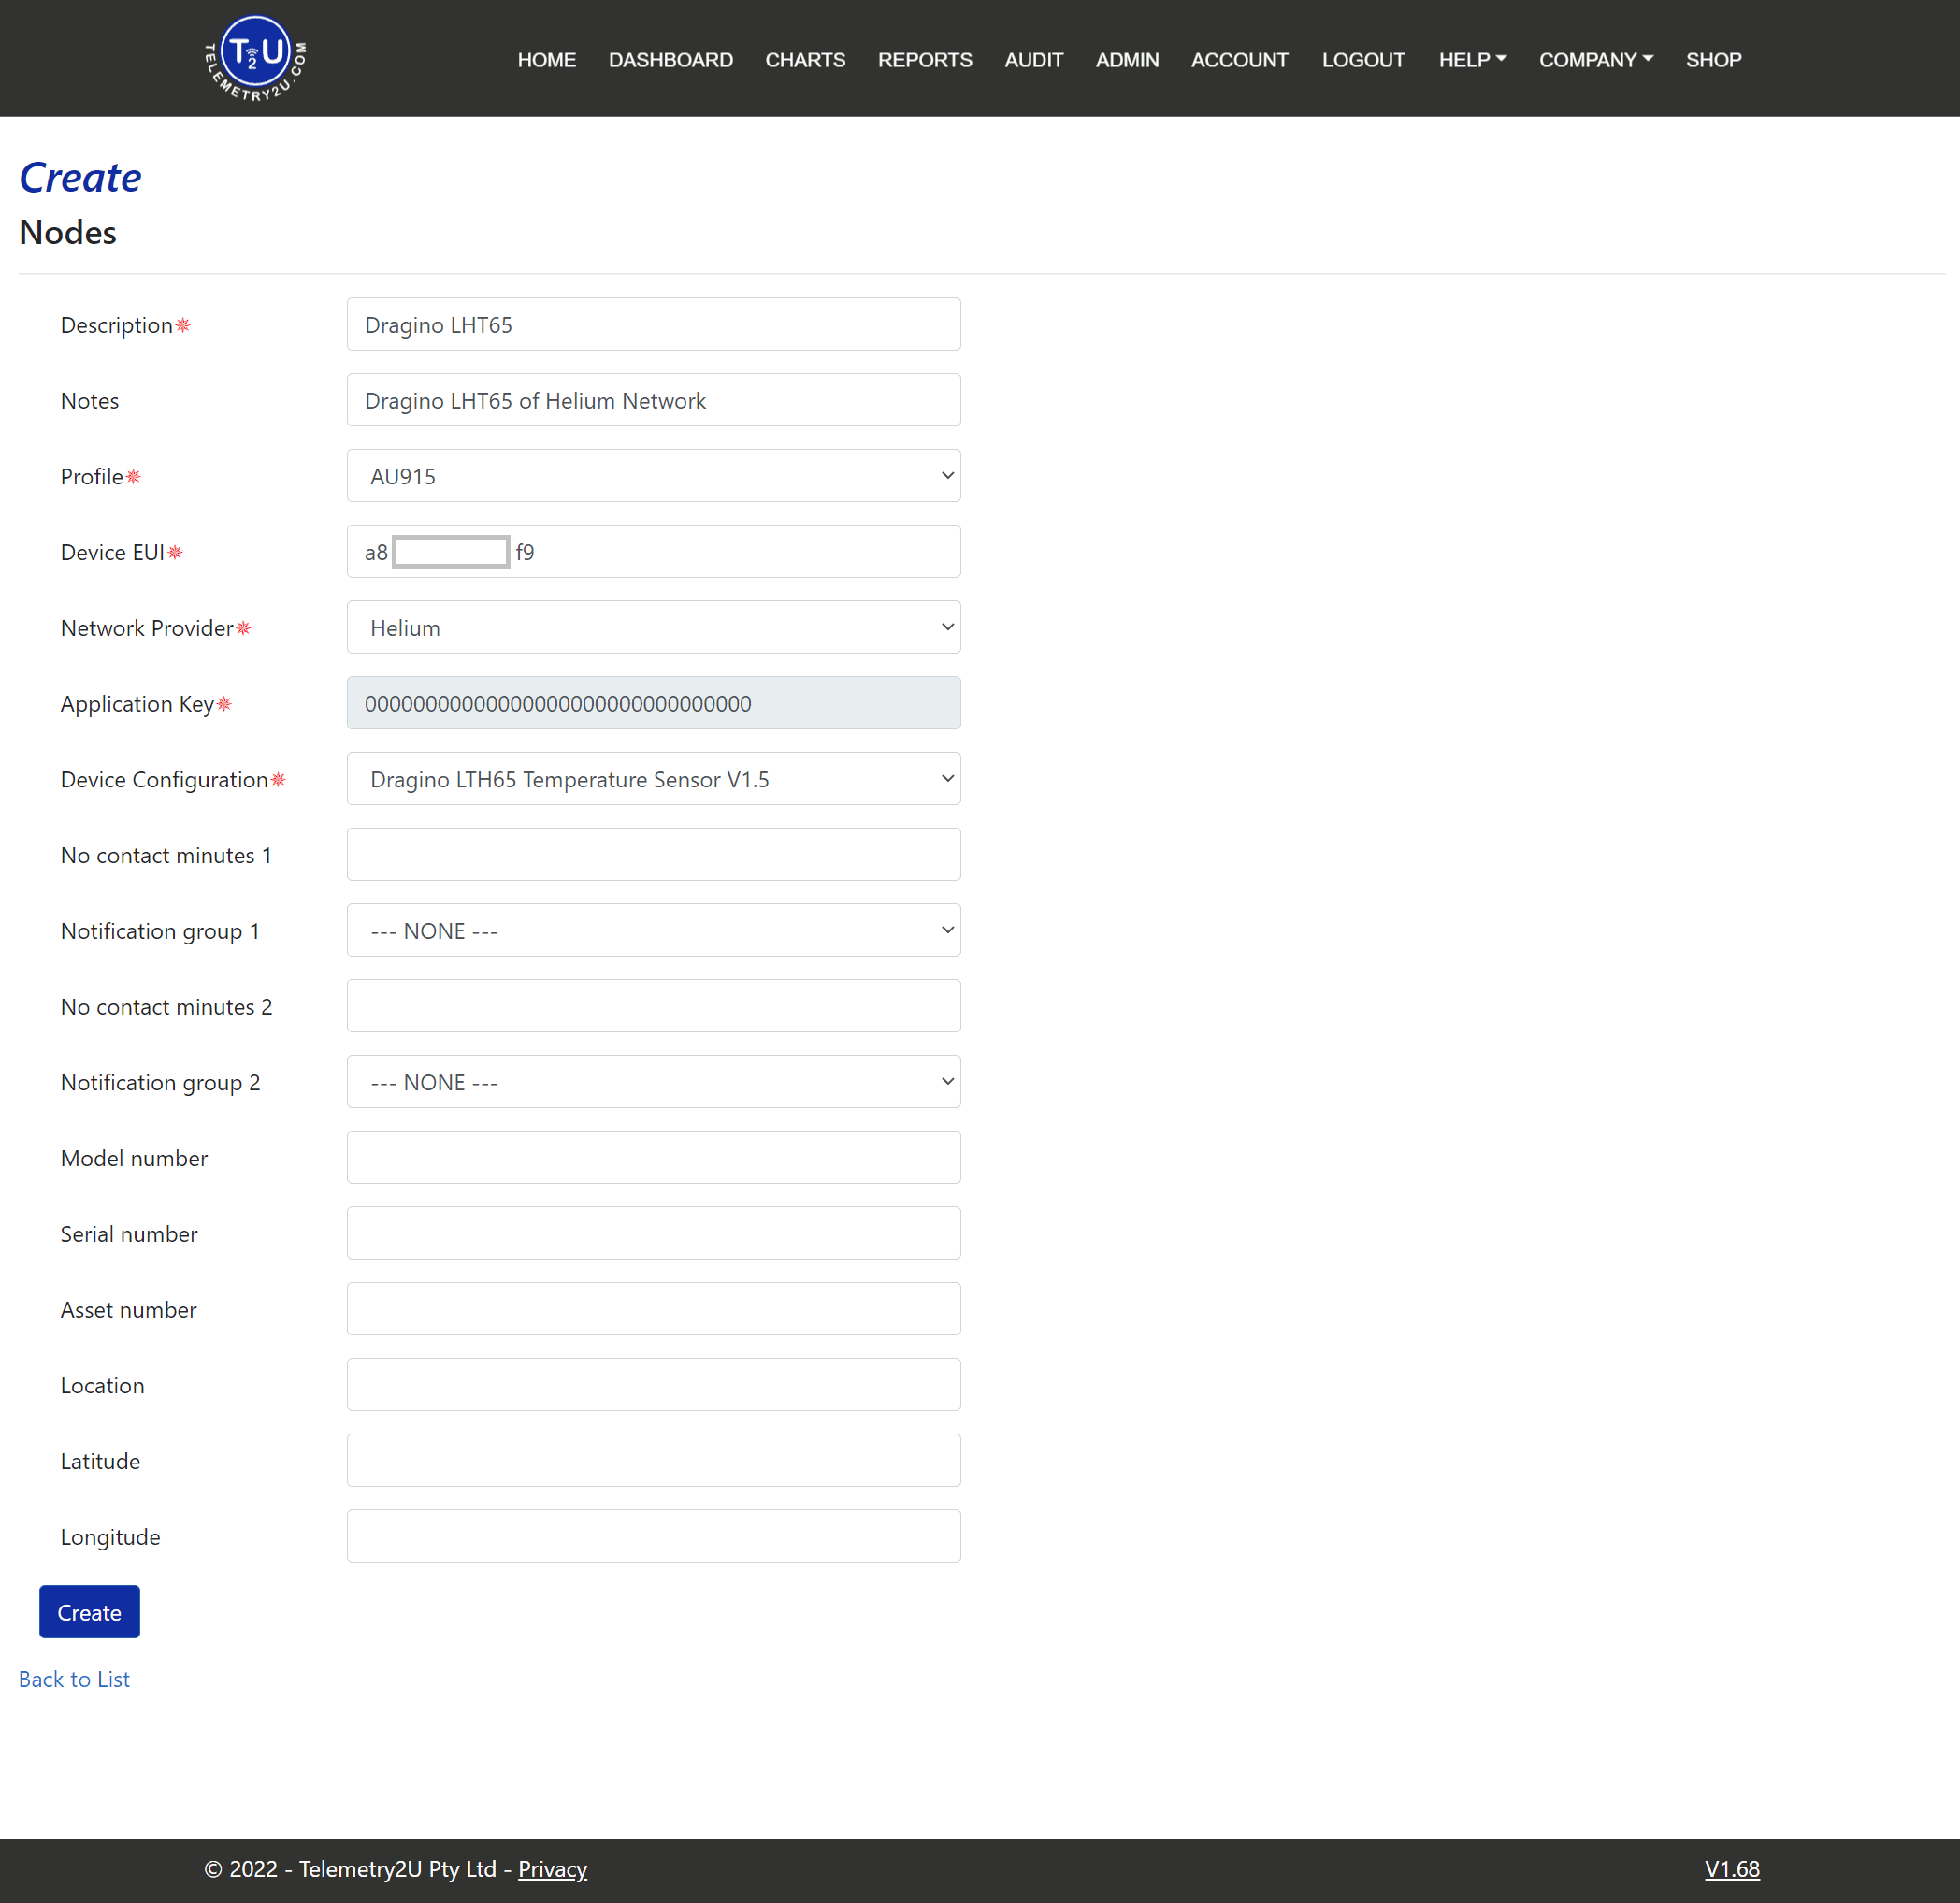
Sign in to Telemetry2U, open Admin > Node Maintenance and select Create New.
- Enter a unique, recognisable value in Description.
- Select AU915 as the profile for this Australian example.
- Enter the device's Device EUI.
- Select Helium as the Network Provider.
- Select the matching Device Configuration, such as Dragino LHT65 Temperature Sensor V1.5 for the device shown.
- Complete any required notification, asset and location fields, then select Create.
Device configuration not listed? Create or assign the required payload decoder and downlink commands before relying on decoded readings. See the custom payload decoder example for the current Telemetry2U workflow.
3. Create the Helium Profile and Register the Device
Keep Telemetry2U open in one browser tab and sign in to the hosted Helium Console in another. Create the device profile first, because it is selected during device registration.
Create the Device Profile
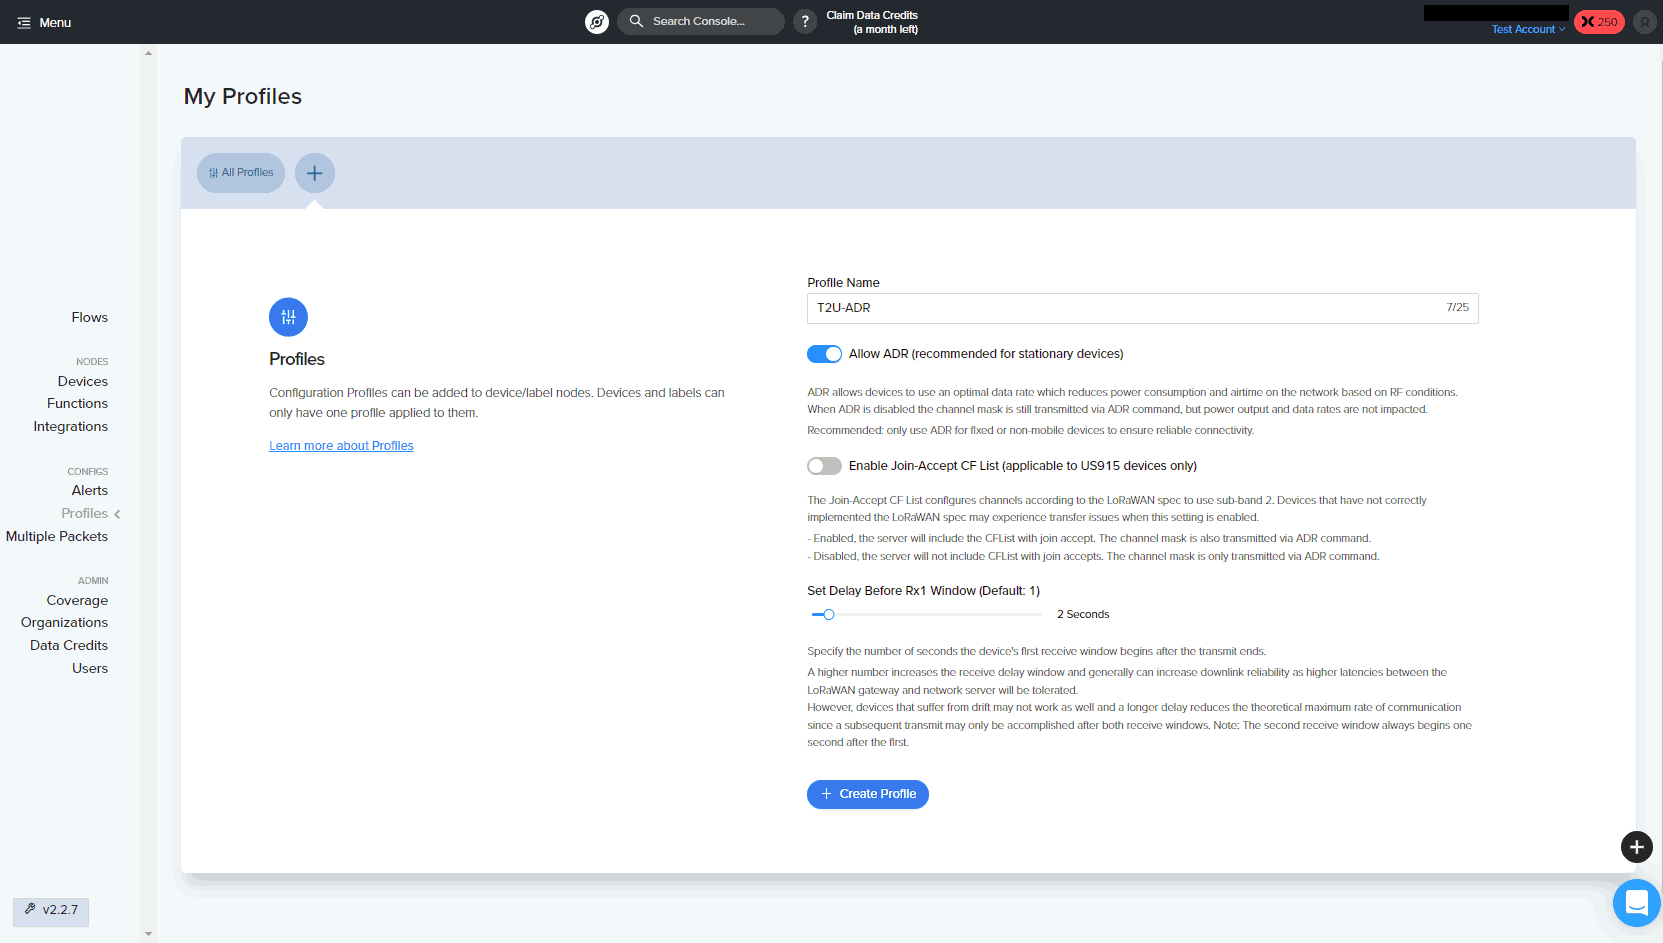
- Open Profiles and select Add New Profile.
- Enter a unique profile name.
- Enable Allow ADR when ADR is enabled on the device.
- Leave Enable Join-Accept CFList off for this AU915 example.
- Set the delay before the Rx1 window to 2 seconds.
- Select Create Profile.
Register the LoRaWAN Device
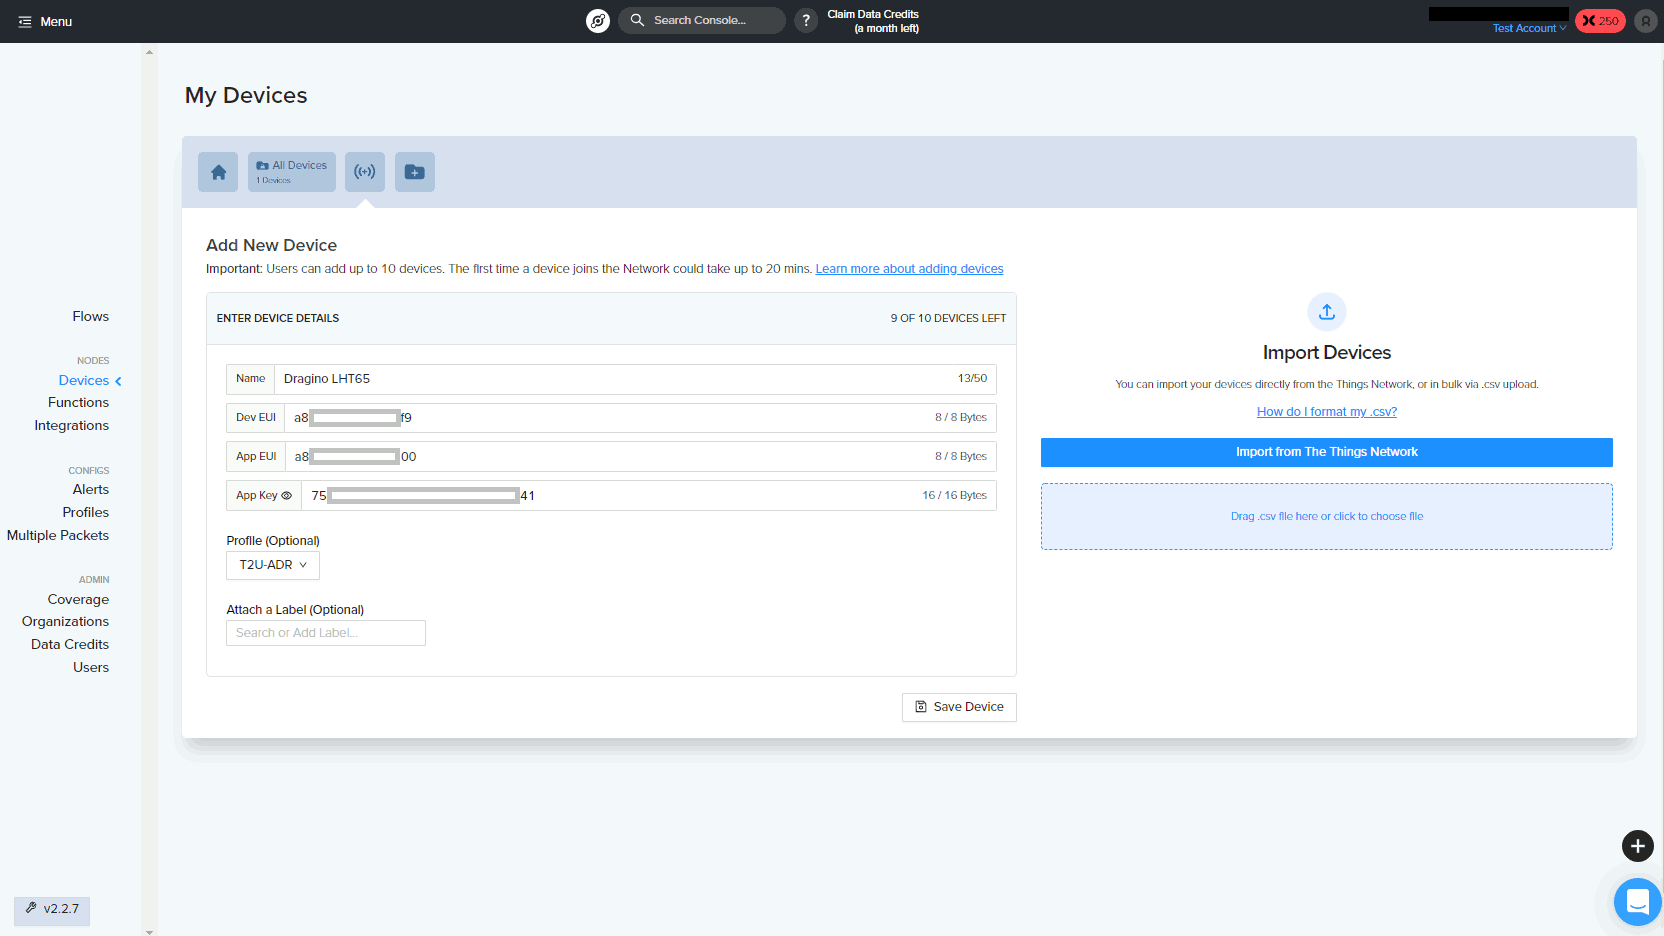
- Open Devices and select Add New Device.
- Enter a unique device name.
- Paste the DevEUI, AppEUI and AppKey without spaces.
- Select the profile created for this device.
- Select Save Device.
The device may remain in a pending state while the Console updates its routing information. Allow up to 30 minutes before treating this as a fault.
4. Create the Helium HTTP Integration
Generate the account-specific integration credentials in Telemetry2U, then use them to create a custom HTTP integration in Helium Console.
Generate Telemetry2U Details
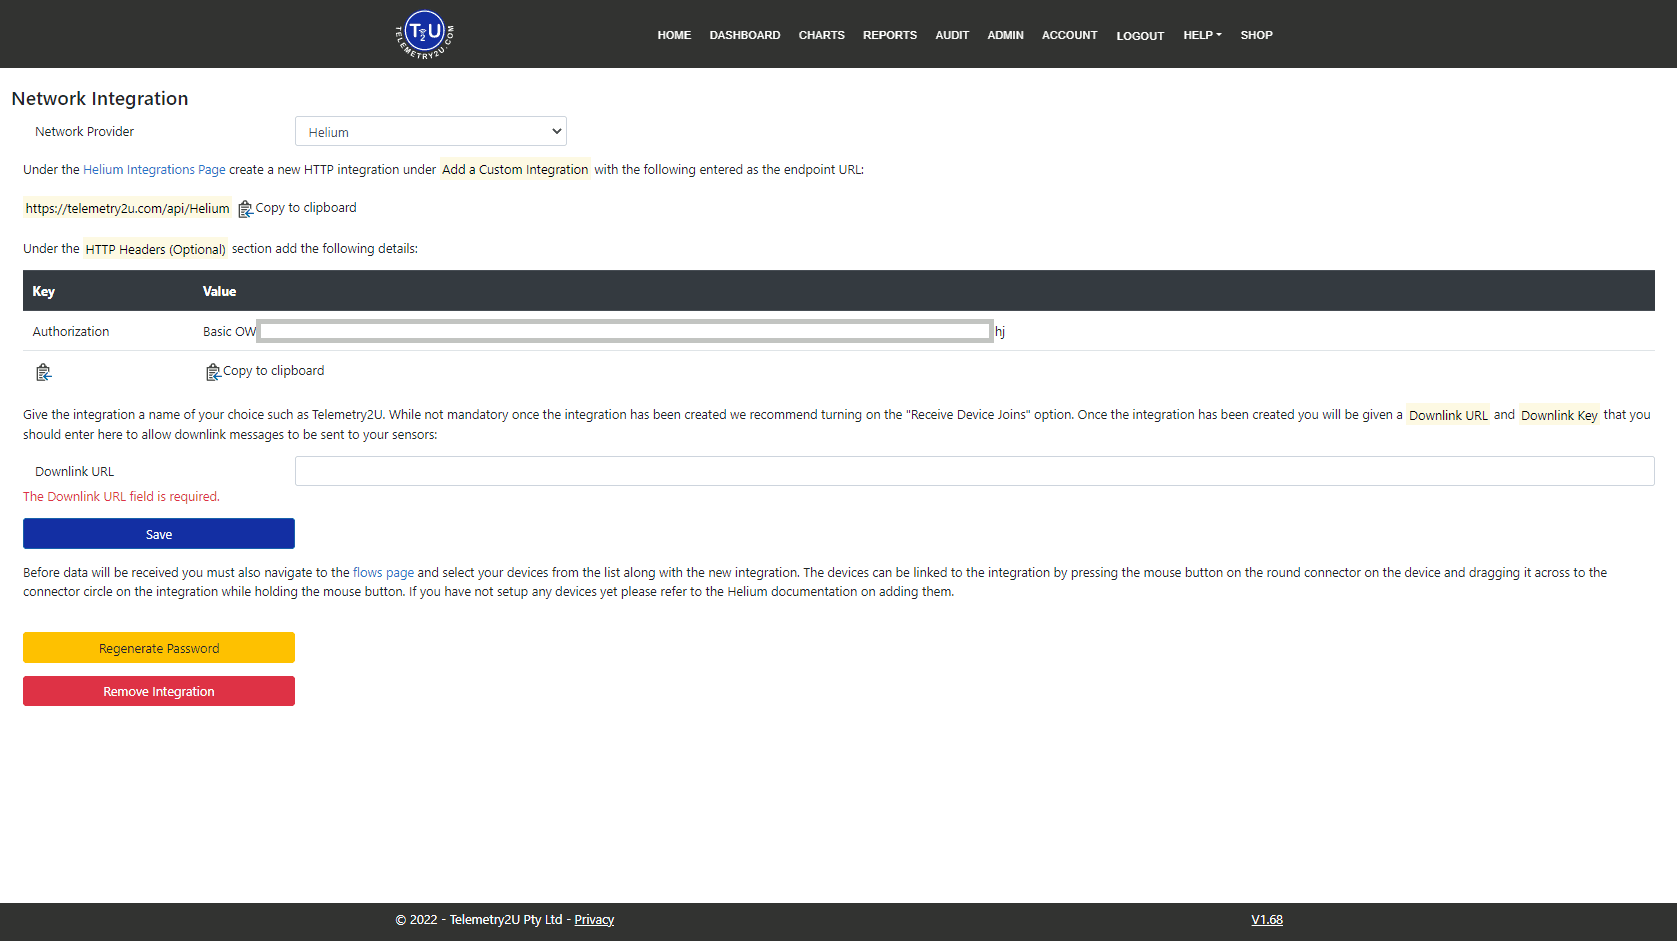
- Open Admin > Setup Integration.
- Select Helium as the network provider.
- Select Add Integration if a Helium integration does not already exist.
- Keep this page open while configuring Helium Console.
Create the Helium HTTP Endpoint
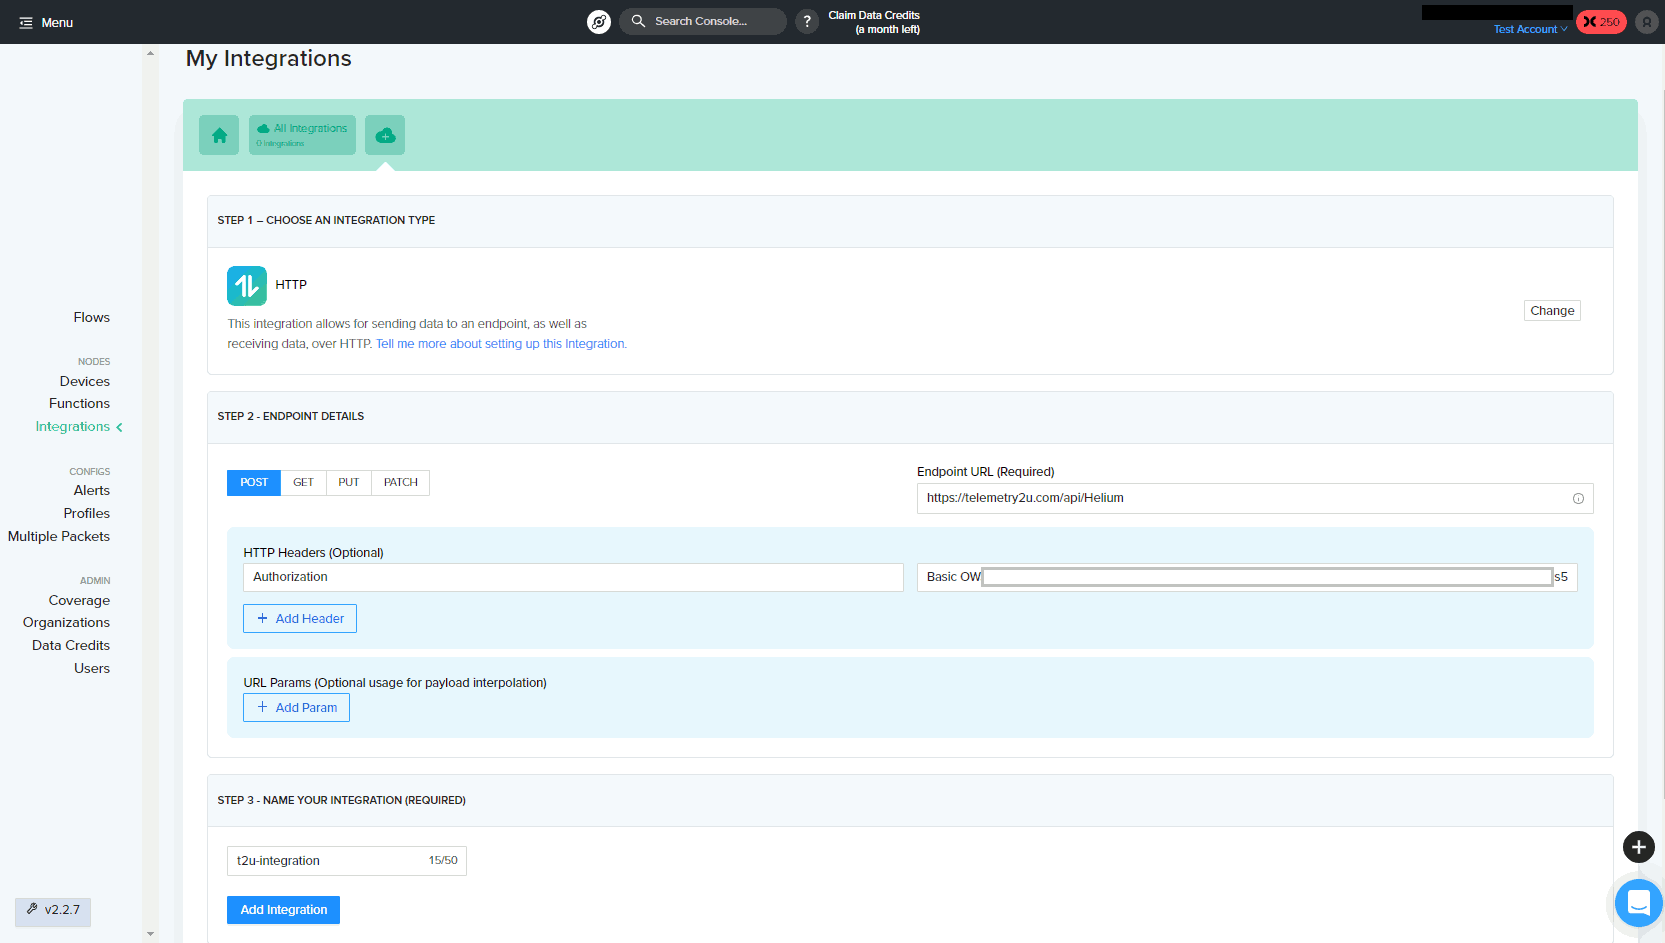
- Open Integrations and select New Integration.
- Under custom integrations, select HTTP.
- Enter the endpoint:
- Add an HTTP header with as the key.
- Paste the full value generated by Telemetry2U, including the
Basicprefix. - Name the integration and select Add Integration.
Complete the Downlink Configuration
After the integration is created, copy its Helium downlink URL and save it in the Telemetry2U integration record. This allows Telemetry2U downlink commands to be returned through the same network-server workflow.
Copy the Helium Downlink URL
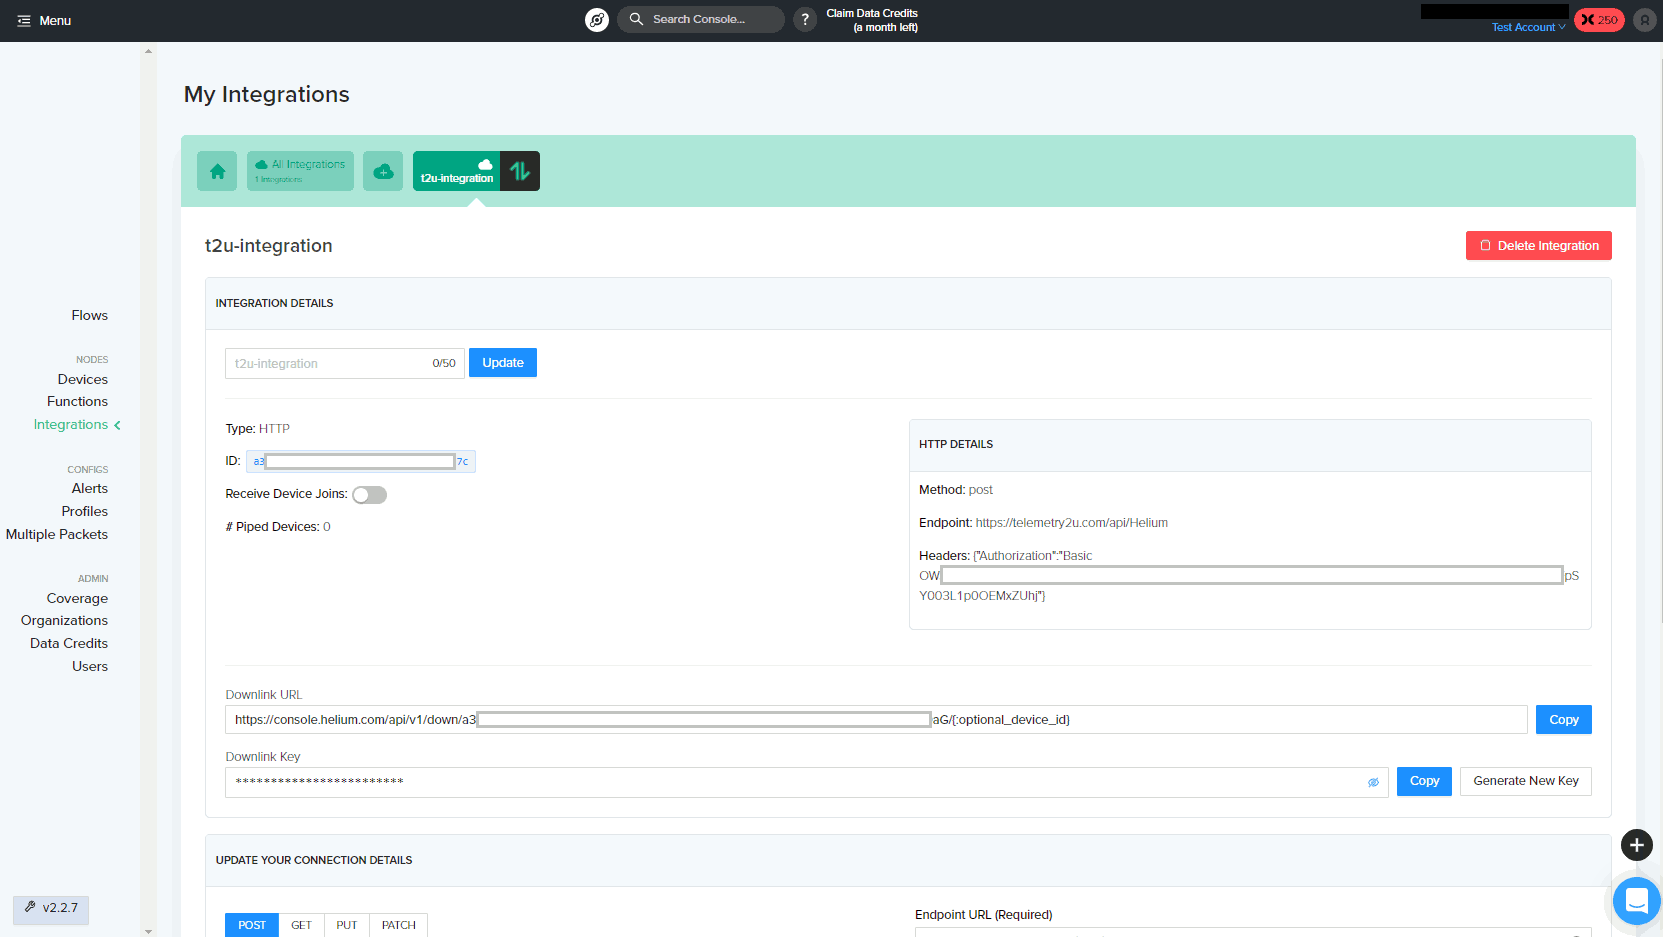
Open the new integration and copy the displayed Downlink URL.
Save the URL in Telemetry2U
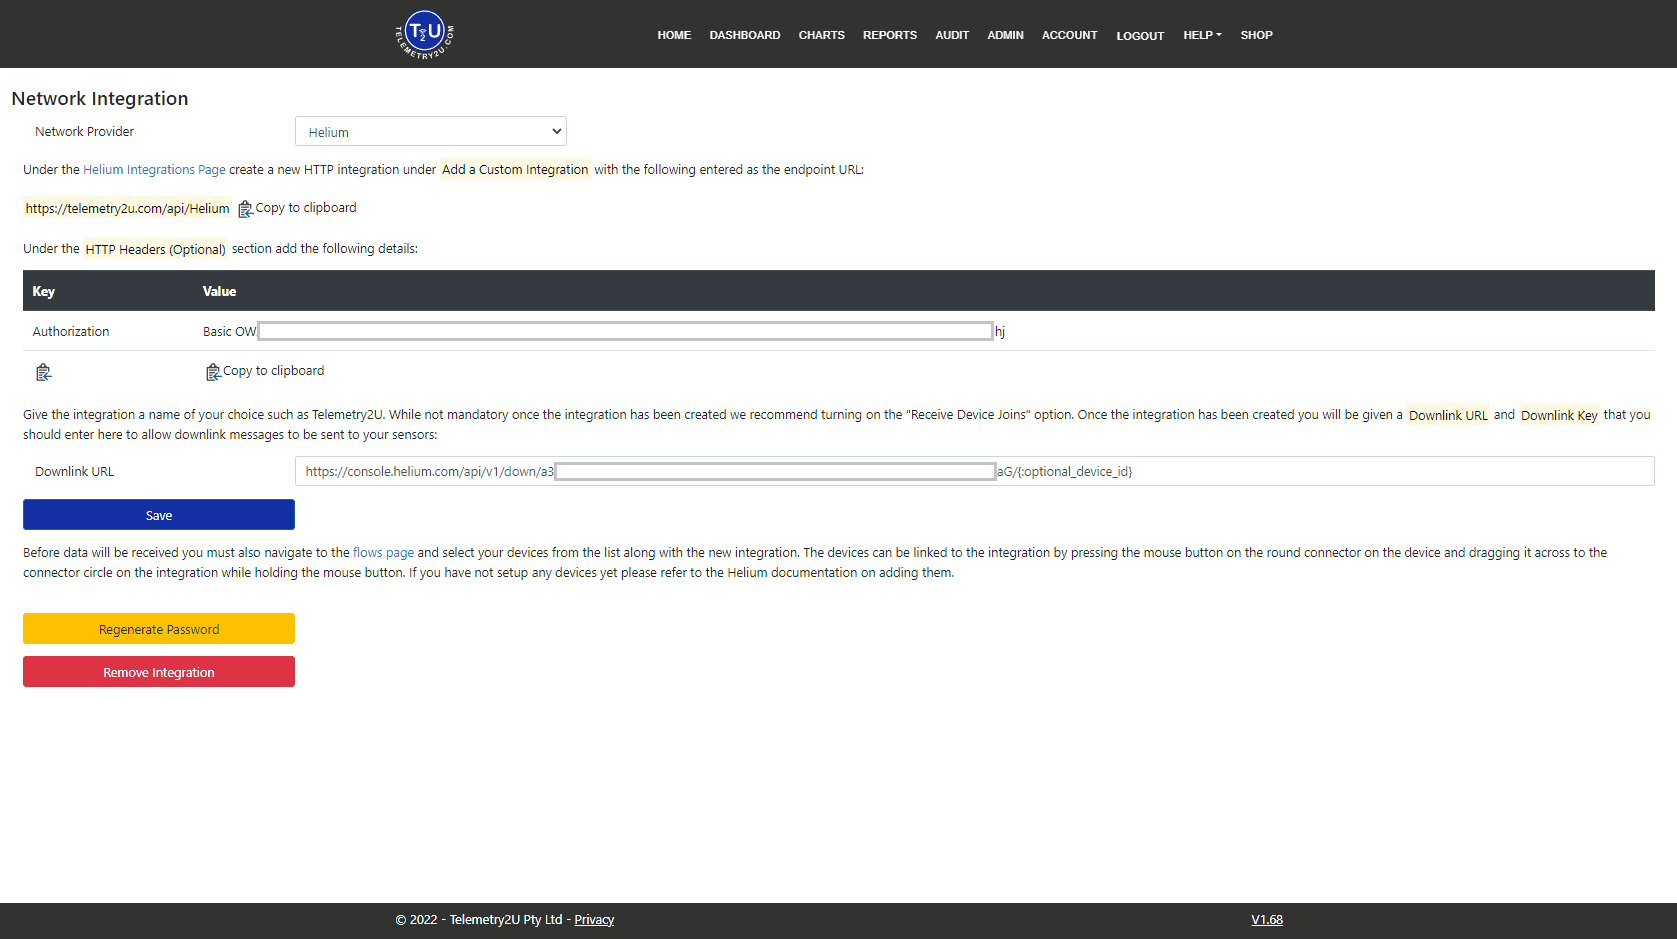
Return to Telemetry2U, paste the URL into Downlink URL and select Save.
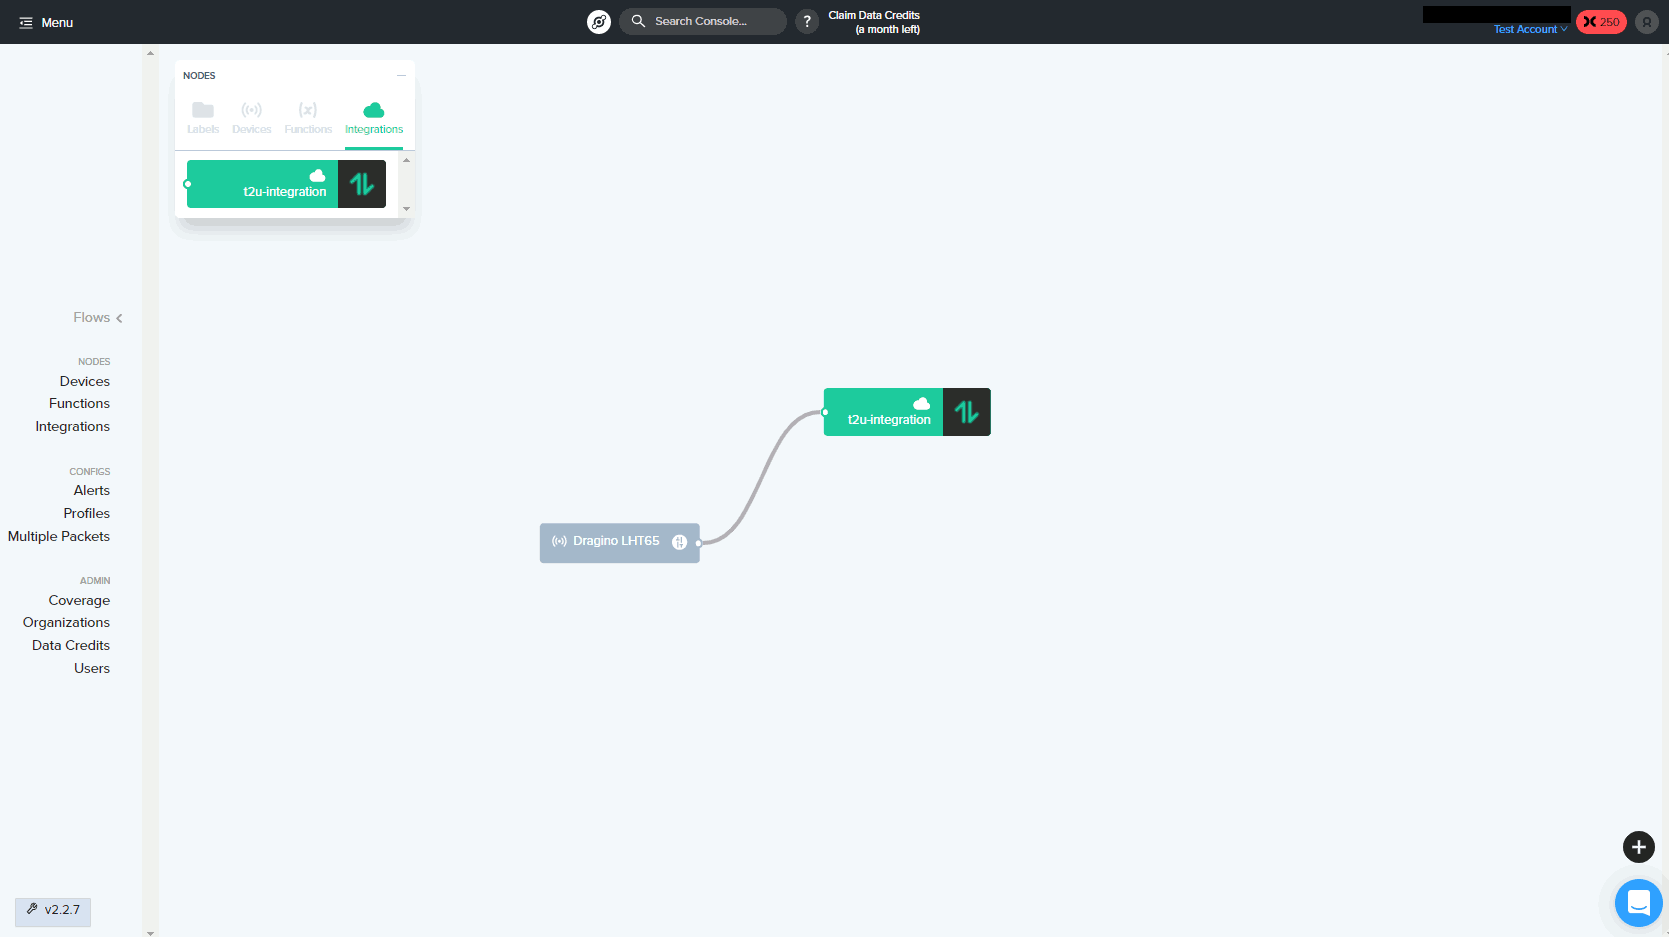
5. Connect the Device and Integration in a Helium Flow
The device will not forward uplinks to Telemetry2U until it is connected to the HTTP integration in the Helium Console Flow workspace.
- Open Flows in Helium Console.
- Add the registered Device to the canvas.
- Add the Telemetry2U Integration to the canvas.
- Drag from the device connector to the integration connector.
- Confirm that the connection line remains visible between the two blocks.
6. Verify Data in Telemetry2U and Helium Console
Allow at least one normal transmission interval, then confirm the complete path in both systems. Telemetry2U verifies decoding and storage; Helium Console helps confirm that the network server received and forwarded the uplink.
Telemetry2U Reports
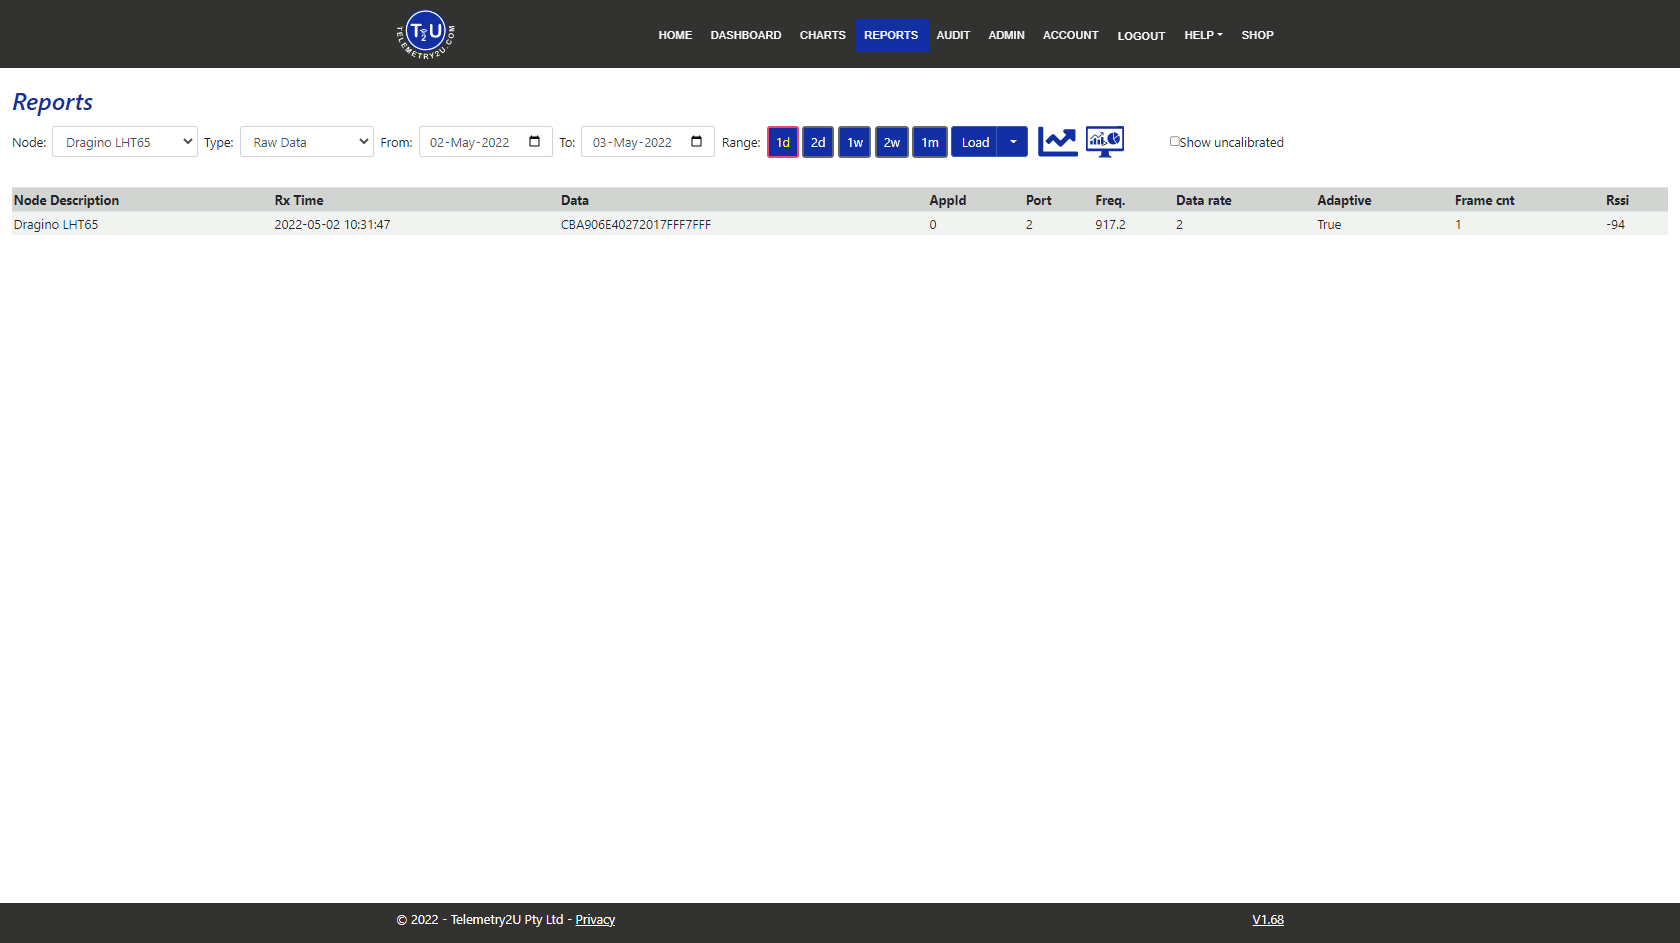
Open Reports, select the node and check for new readings. Use Raw Data when you need to inspect the payload, port, data rate or decoder result.
Helium Device Status
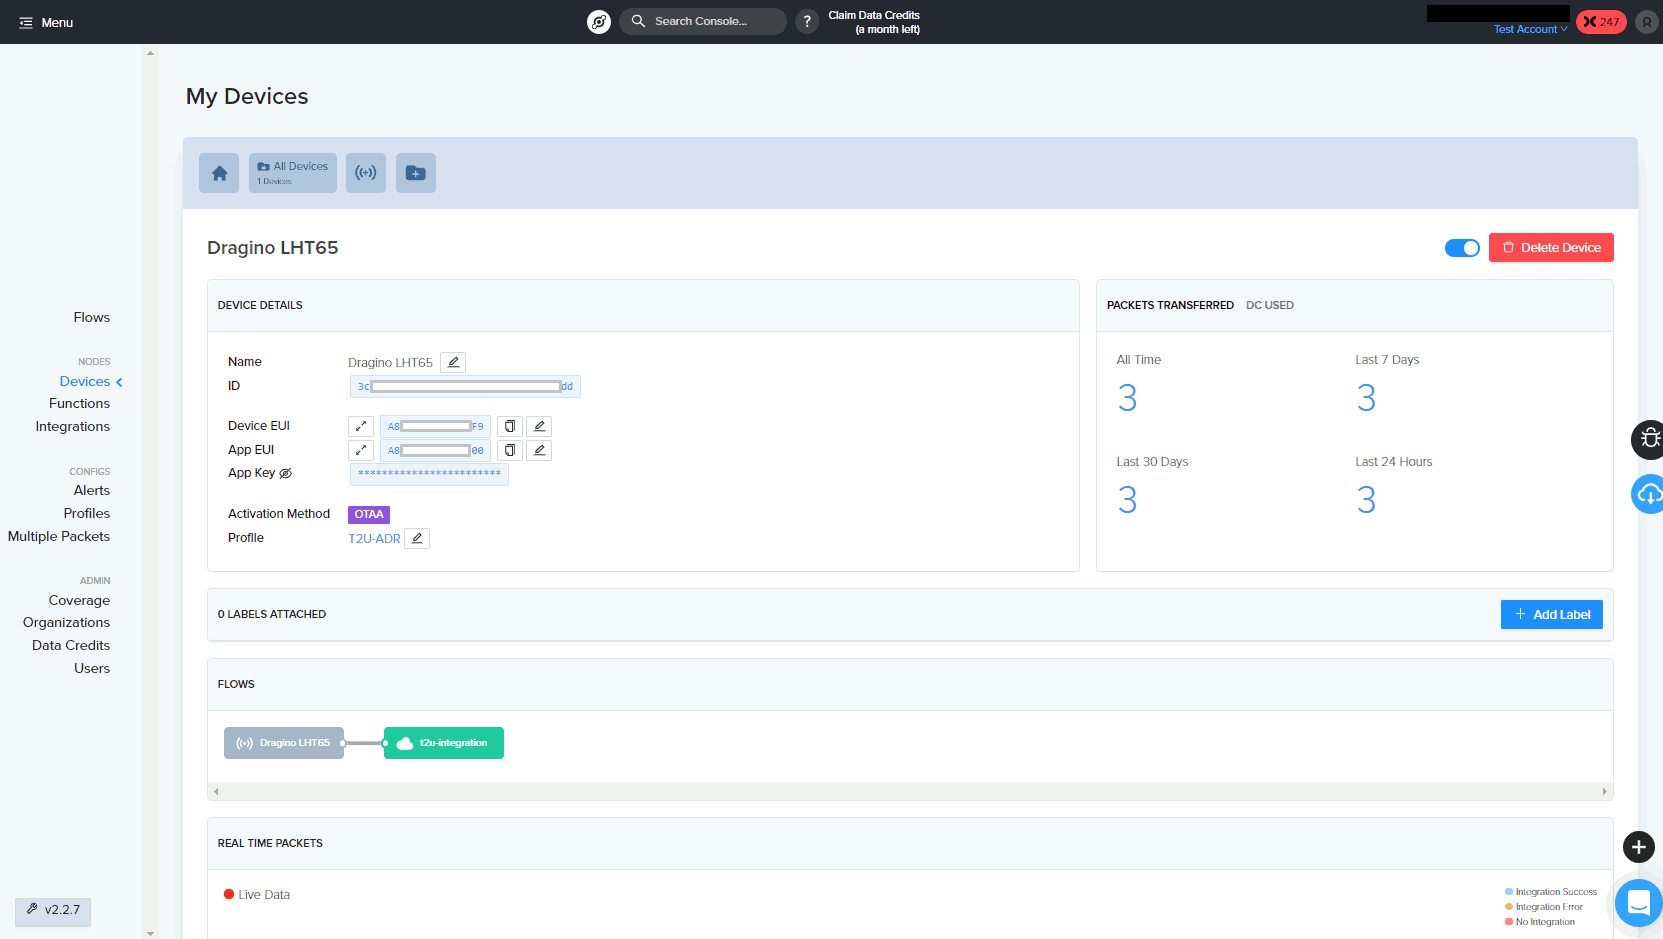
Open the device in Helium Console and review its event or packet information. ADR changes are not immediate, so review several transmissions before assessing the final data rate.
No data in Telemetry2U? Check the device channel group and credentials first, then confirm that the device is connected to the correct HTTP integration in Flows. If Helium receives uplinks but Telemetry2U does not, recheck the endpoint, Authorization header and Telemetry2U downlink URL.