Responding to Temperature Monitoring Alerts
Use this example workflow to identify active temperature alarms, review the sensor trend, reset a shared alarm controller and record the response in Telemetry2U.
Use Telemetry2U as Part of Your On-Call Procedure
Telemetry2U provides the current reading, alert state, historical trend and audit tools needed to assess a monitoring event. The organisation remains responsible for deciding how equipment, contents, escalation and attendance are handled.
Important: this bulletin is an example platform workflow. It does not replace your organisation's approved on-call, equipment-failure, product-protection, escalation or quality procedures.
These tasks can be completed through the responsive Telemetry2U interface on a desktop computer, laptop, tablet or smartphone. For faster access while on call, see How to Install the Telemetry2U App.
Sign in with an account that can view the affected dashboard, node, Charts and Reports.
Know who to contact and which site-specific actions or escalation steps apply.
Email, SMS and voice alerts require the user to be in a Notification Group attached to the relevant Alert Group.
Notification Group membership and alert-management permissions are normally assigned by an administrator or laboratory manager.
1. Scan the Complete Dashboard
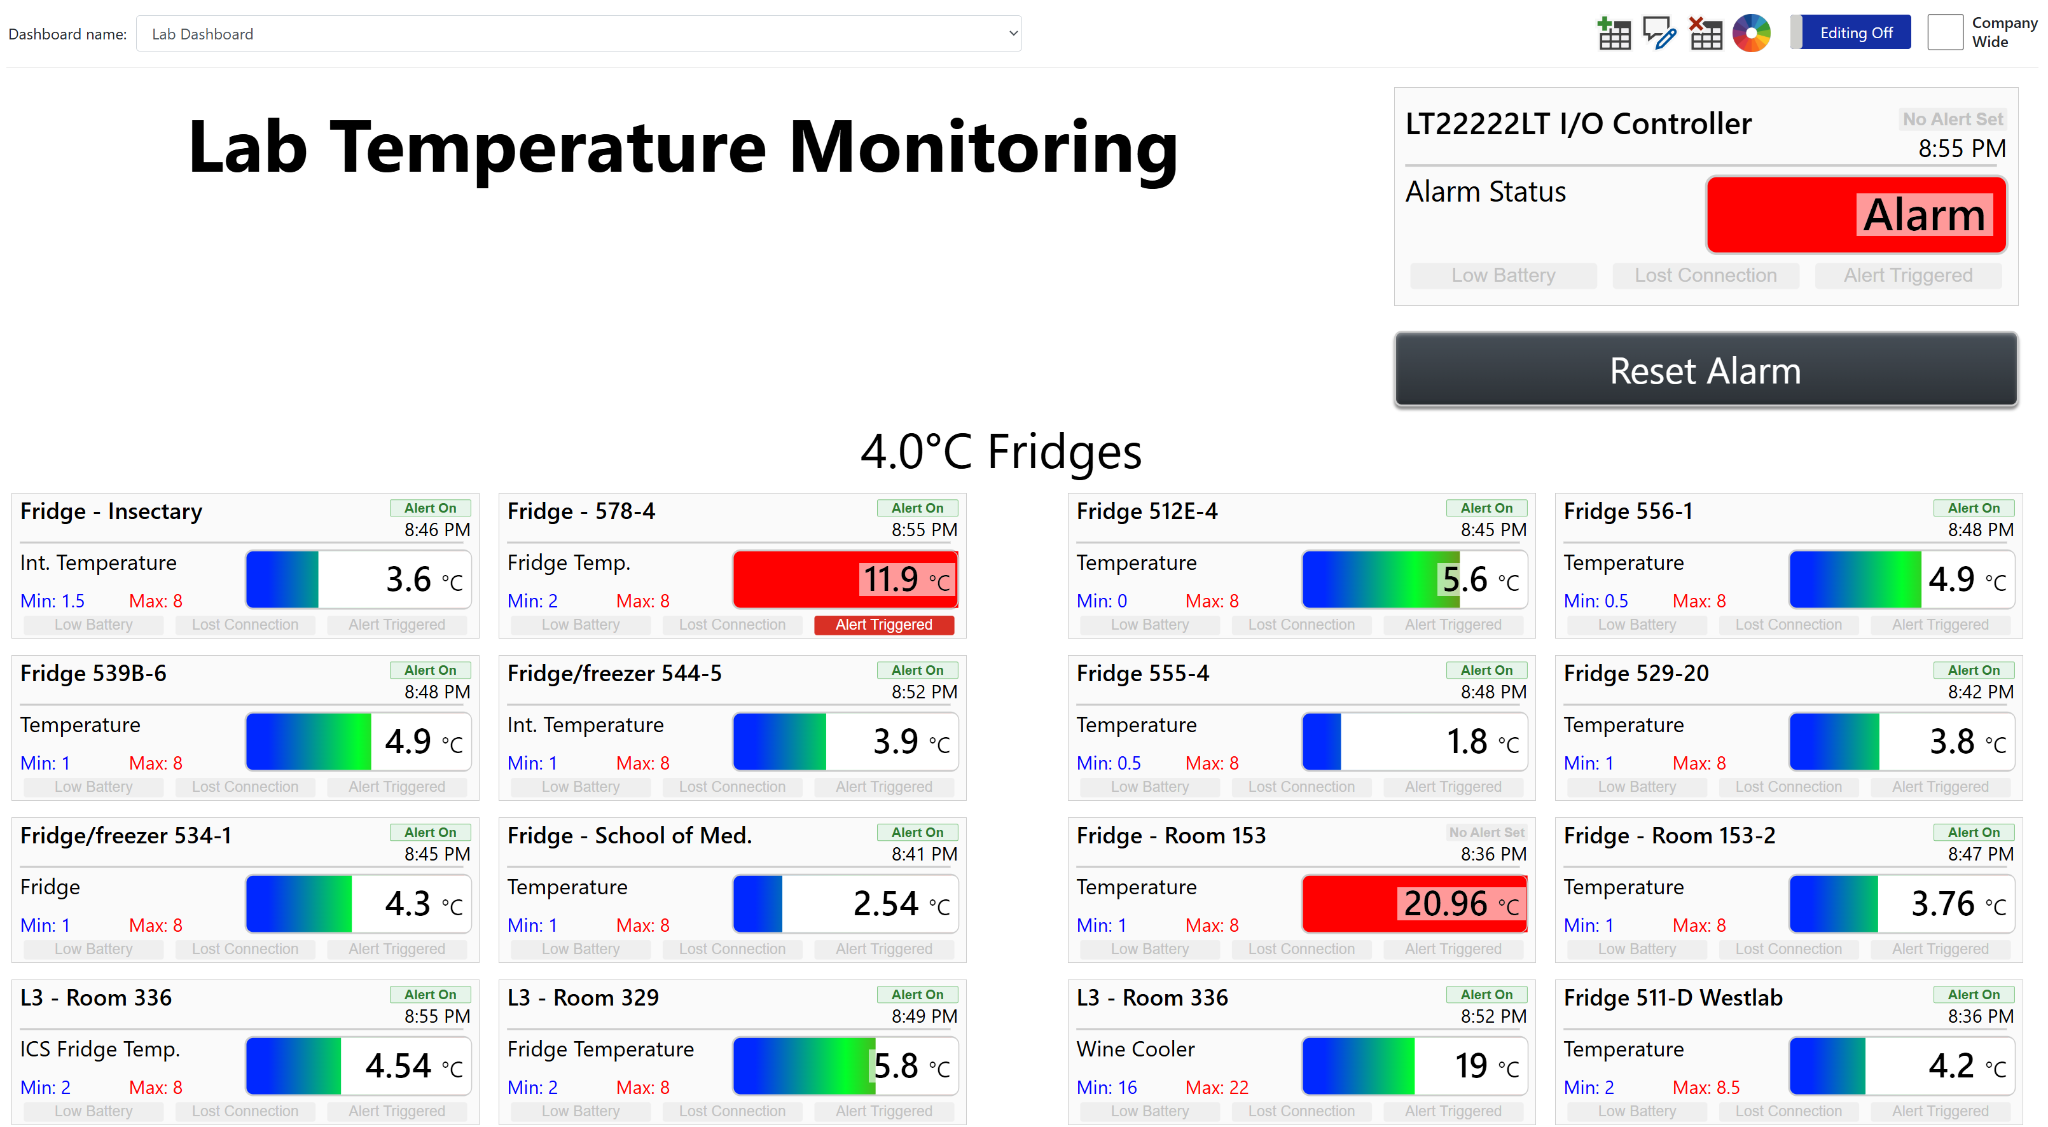
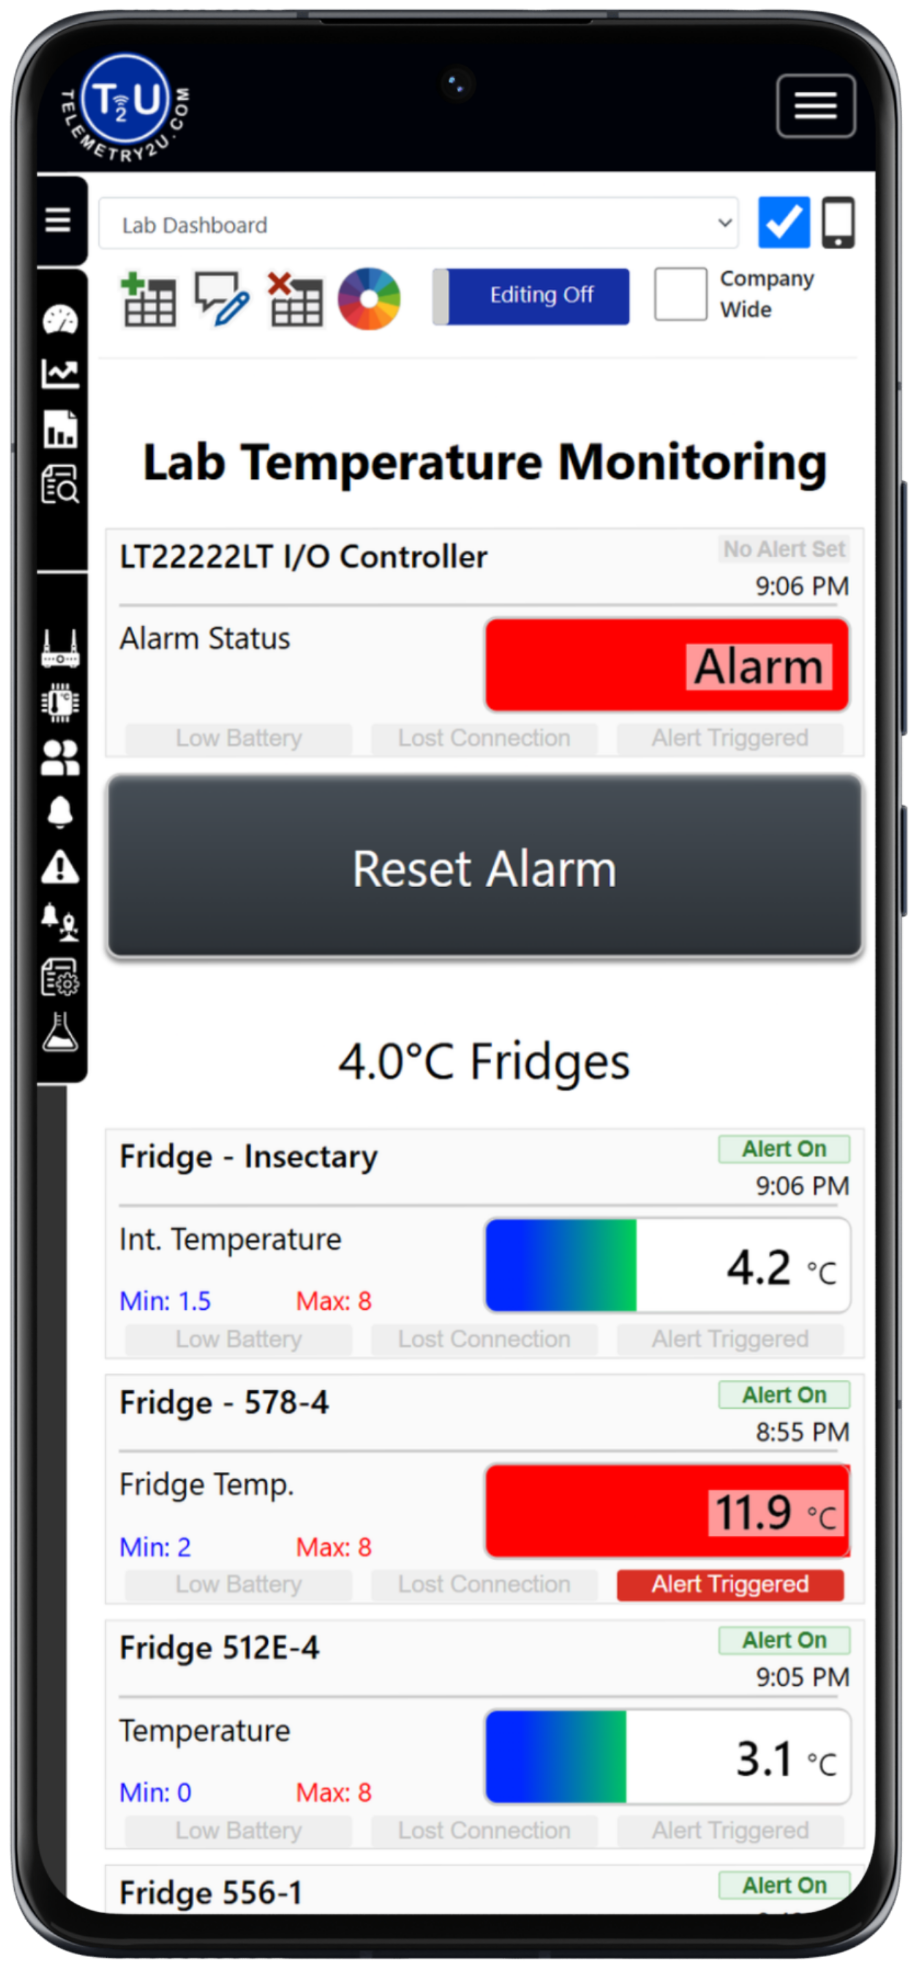
Open the relevant dashboard and scan every widget before resetting an alarm controller. More than one fridge, freezer or monitored device may be in alert at the same time.
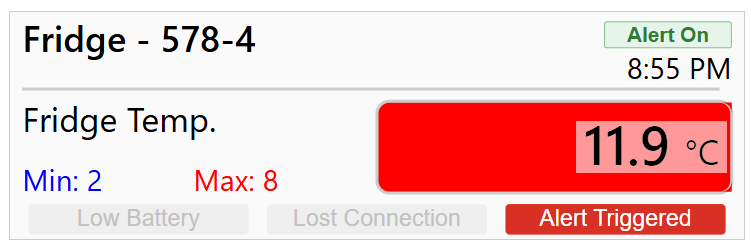
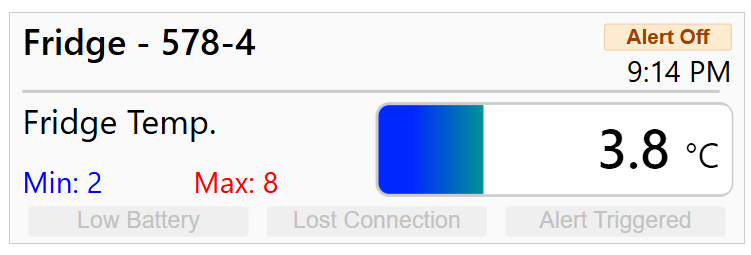
An alerting temperature widget is normally easy to identify. A high-temperature alert can fill the scale red, a low-temperature alert can fill it blue, and the Alert Triggered badge changes to red. The alert-status badge in the top-right corner shows whether the alert is on, off or not configured.
Check the Widget Status Badges
A red badge confirms that the configured alert condition has been reached.
Confirm whether monitoring is enabled. Check with management before changing an unexpected disabled state.
A red badge indicates that the node battery requires attention under the site's maintenance procedure.
An orange badge indicates that the node has stopped communicating. Check this before relying on the displayed reading.
Lost connection: many supported LoRaWAN devices can be restarted by holding their device button for approximately five seconds. Follow the model-specific instructions before resetting a node.
2. Review the Trend on the Charts Page
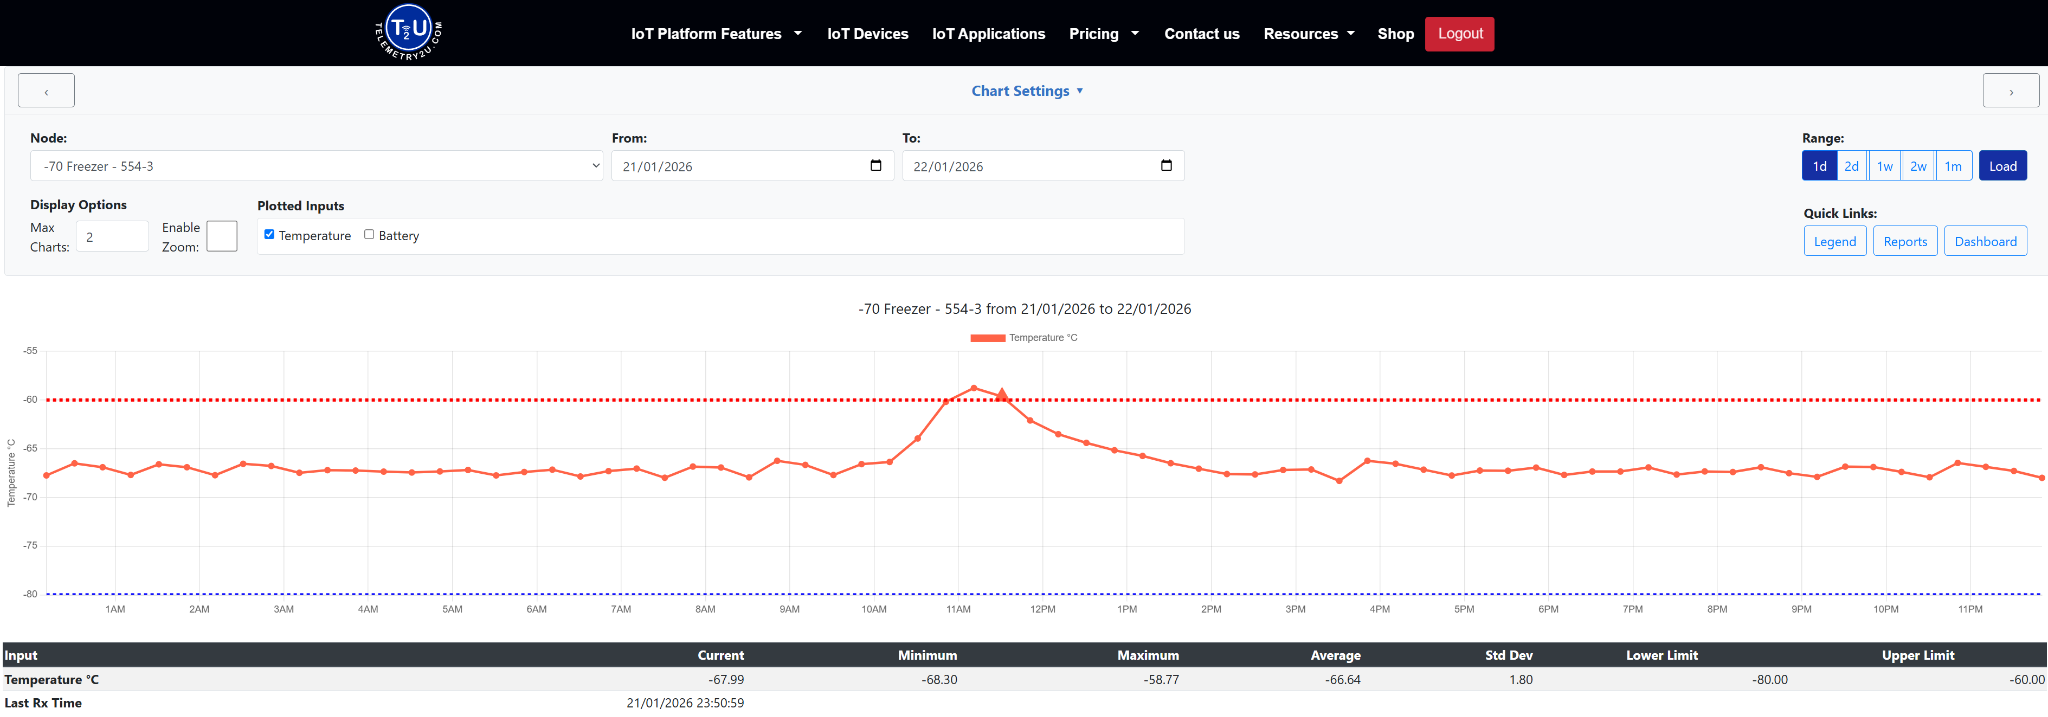
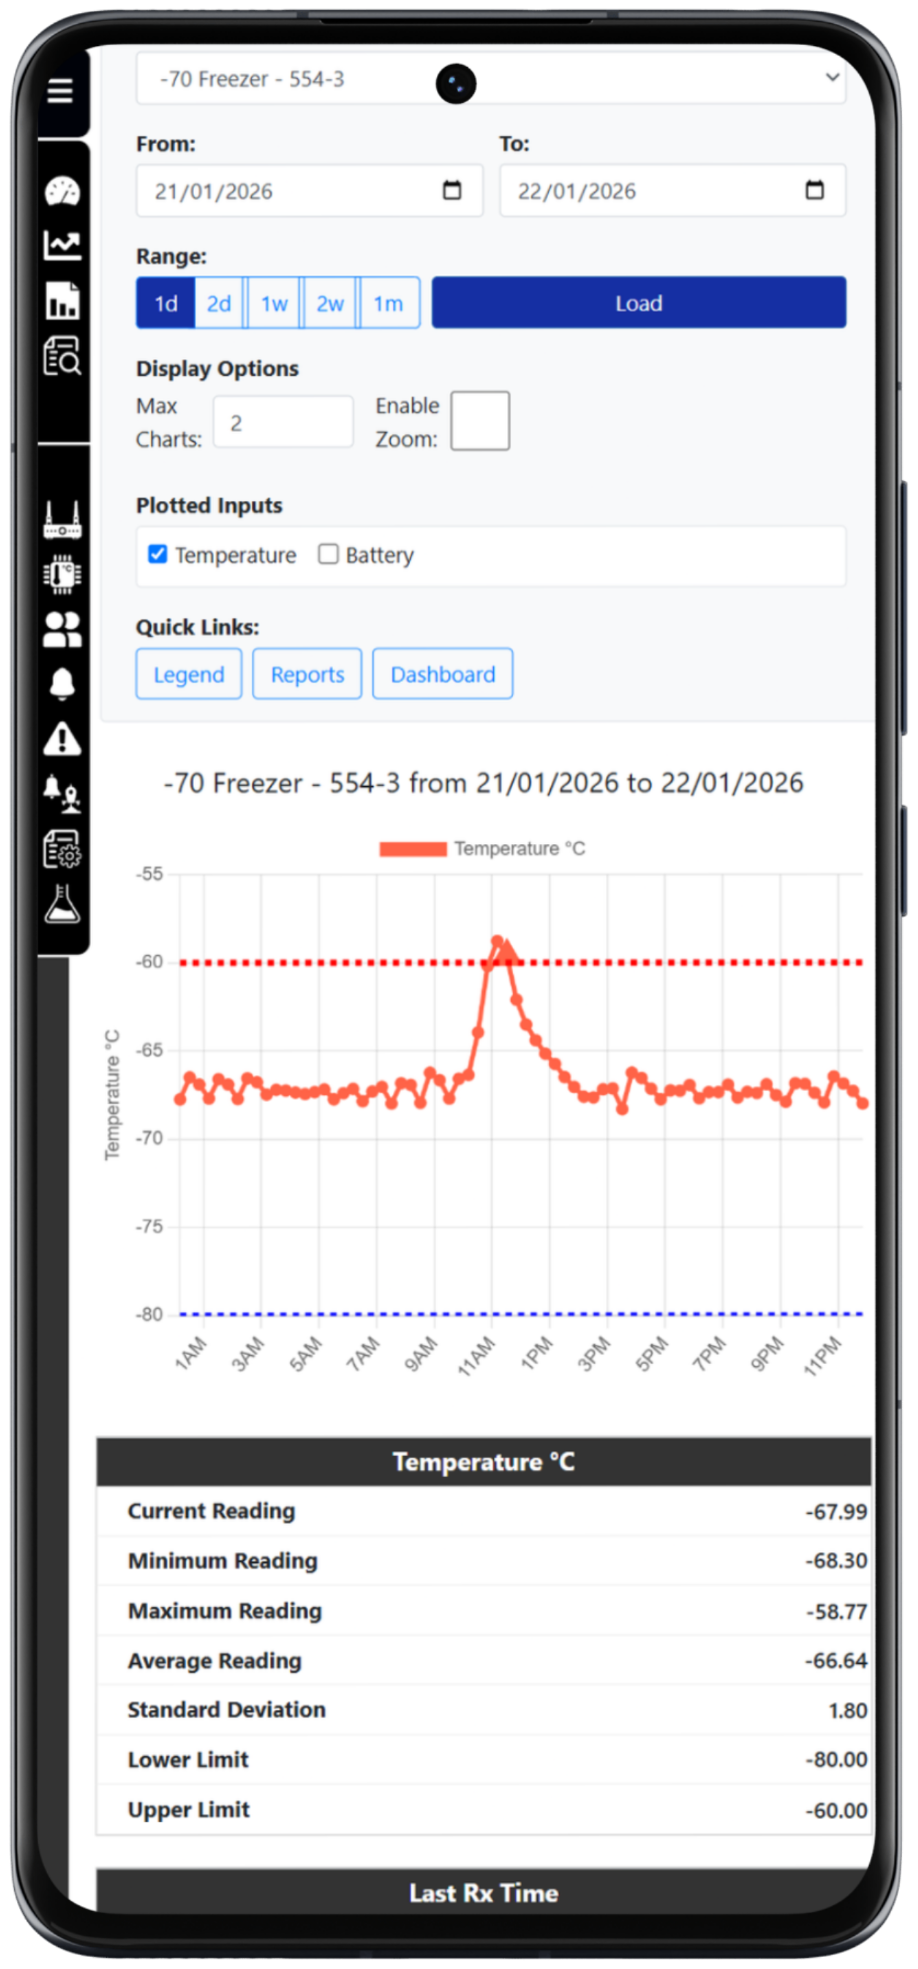
Select the affected dashboard widget to open Charts. Review what happened before the alert and whether the reading is continuing in the wrong direction, stabilising or returning towards its normal range.
A chart may show a short excursion caused by a known event, or a sustained change that requires a different response. Where permitted by the organisation's procedure, the responder may continue observing the trend before deciding whether further attendance or escalation is required.
The responsive Charts page provides the same date controls, quick links, limits and summary values on a smartphone, tablet or desktop computer.
3. Follow Your Organisation's Response Procedure
Use the current reading and chart history to inform the decision required by your organisation's approved on-call process. Telemetry2U supplies the monitoring information; the organisation determines the response.
The required attendance, escalation, equipment checks, acceptable response time and handling of monitored contents depend on the site, equipment and materials involved. Follow the applicable local procedure.
4. Reset the Shared Alarm Controller
After every active dashboard alert has been identified and assessed, select Reset Alarm on the dashboard. This returns the shared I/O controller to a state in which a later alert can produce a new output transition.
A single controller may be linked to many monitored devices. If it remains latched after the first event, a later alert from another fridge, freezer or temperature-controlled device may not retrigger the connected building alarm or other downstream notification process.
Controller in Alarm
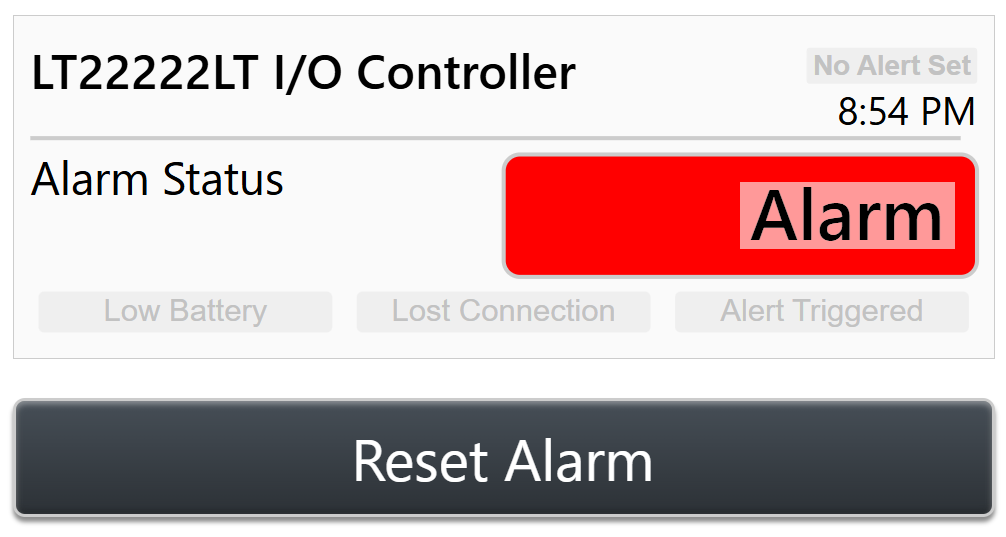
Confirm that all visible alerts have been recognised before selecting the reset control.
Controller Reset
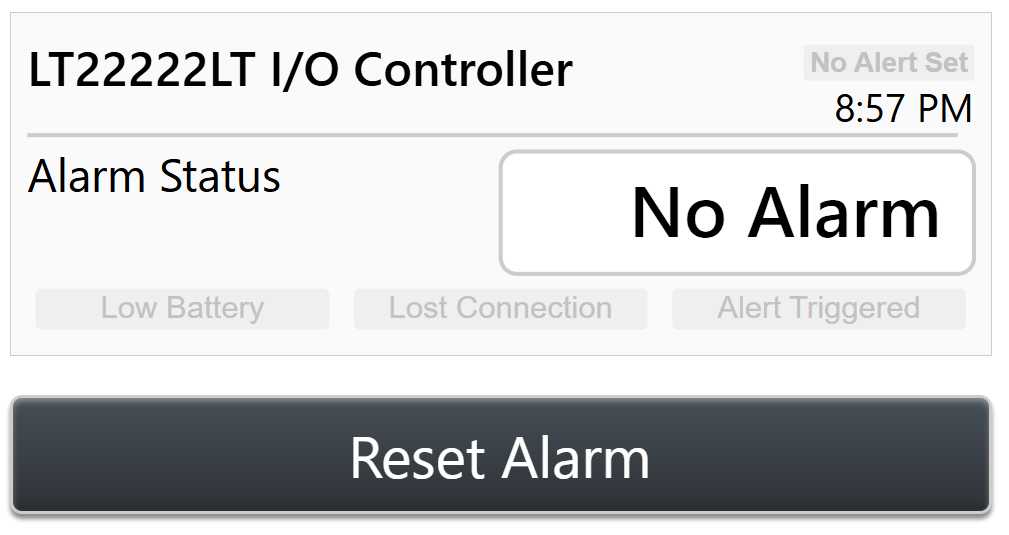
The controller can also reset automatically when a monitored condition returns within range.
A known device may remain in alert after the controller is reset. This is acceptable when the responder has identified and assessed the condition. That same condition will not create a new alert transition until it first returns within range and later enters alert again.
5. Disable an Alert When Required
When a monitored fridge, freezer or other device has been deliberately taken out of service, an authorised user may disable its alert conditions until the equipment is repaired and returned to normal operation.
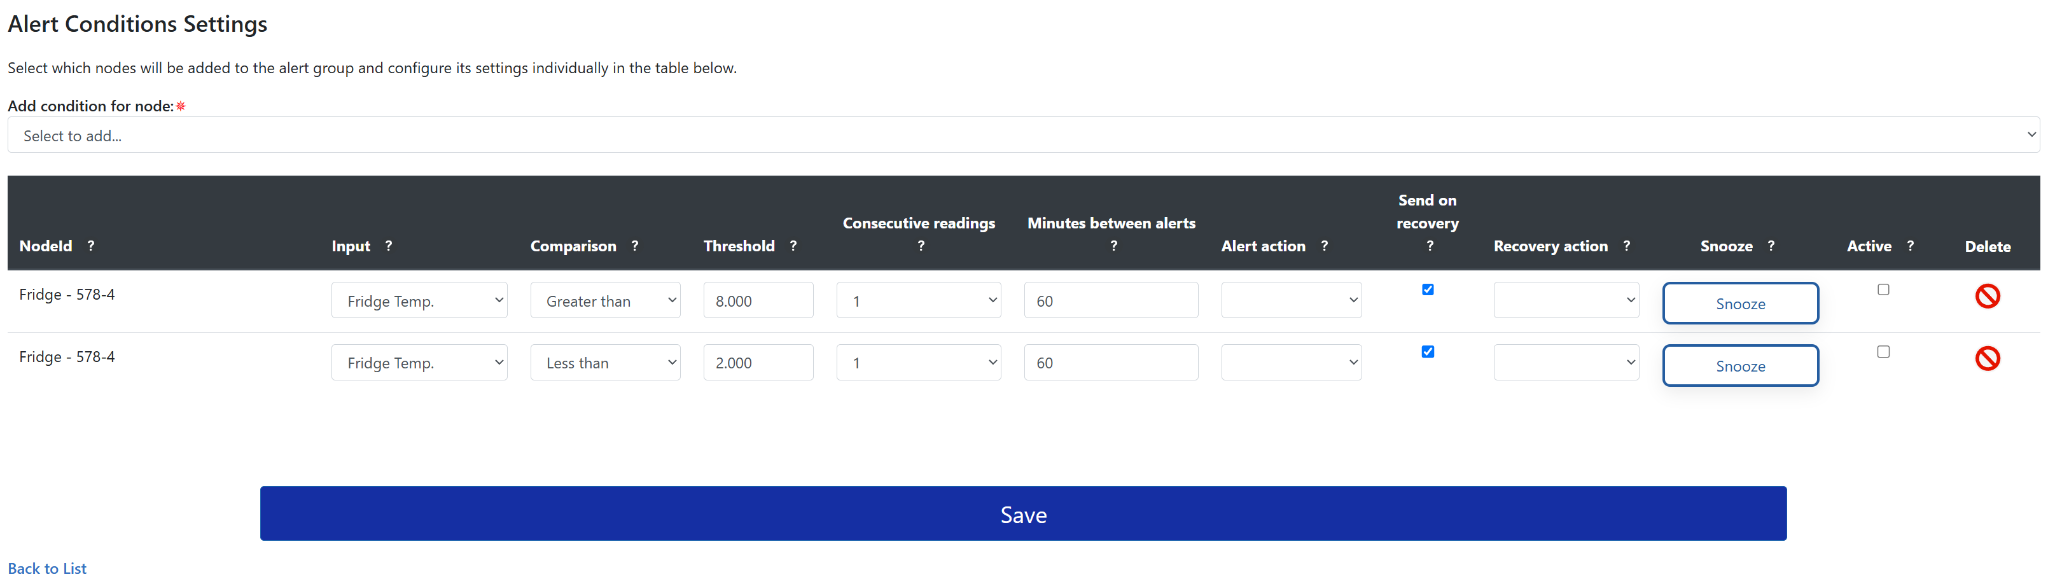
Permission may be required
Some on-call users can view alerts but cannot edit Alert Groups or conditions. If the snooze or Active controls are unavailable, contact the Telemetry2U administrator or laboratory management.
Do not disable an unexplained alert simply to stop notifications. Confirm the intended action under the organisation's procedure.
See How to Manage Alert Groups and Alert Conditions for the complete alert-management procedure.
6. Record the Response with an Annotation
Add a concise annotation so laboratory management and authorised reviewers can see why the alert occurred, what action was taken and what outcome was expected or observed.
A useful note can remain simple: likely cause, action taken, expected or observed outcome. Include additional information only when it assists the organisation's audit or follow-up process.
Add an Annotation from Reports
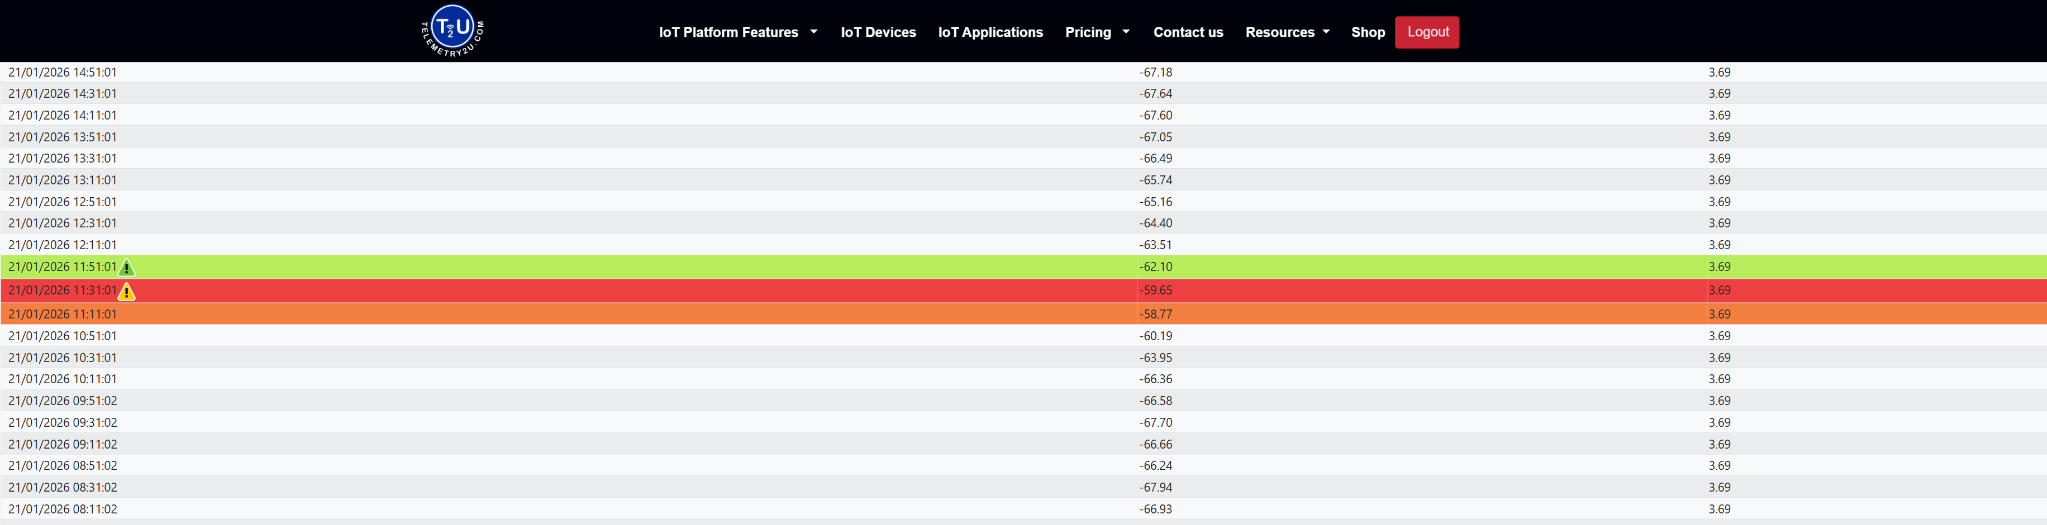
From Charts, use the Reports quick link. Locate the relevant alert or recovery row, then select the event icon beside the date and time to open the annotation form.

Select the yellow warning icon on a red row to annotate the active alert event and record the initial response.

Select the green recovery icon to document that the monitored condition has returned to its normal range.
Enter the Annotation Details
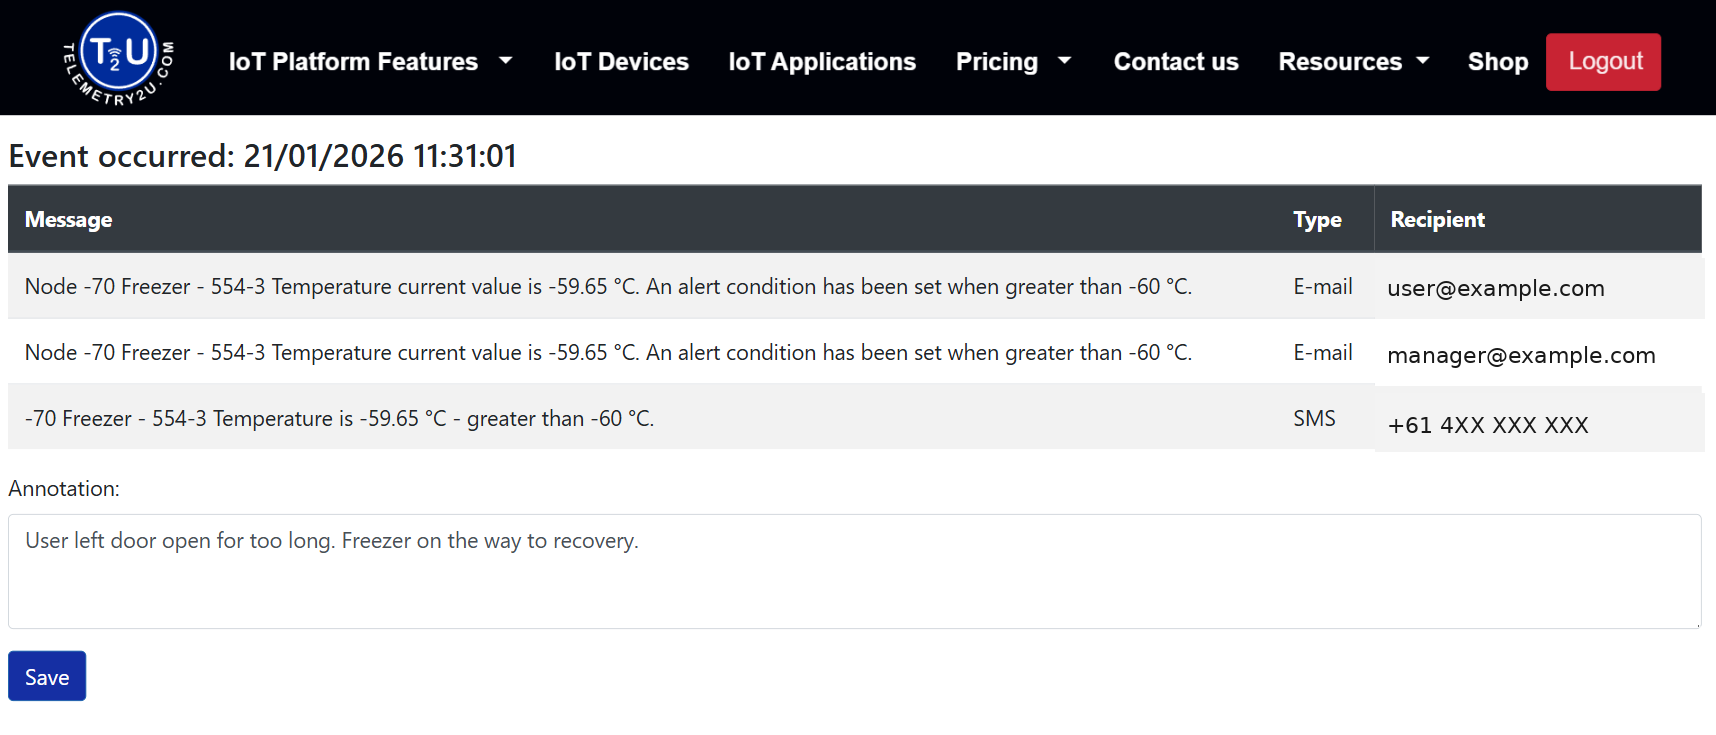
Selecting either the active-alert or recovered-alert icon opens the annotation form for that event. Confirm the event time and notification details, enter a concise note describing the cause, action taken and expected or observed outcome, then select Save.
Use Manage Annotations as an Alternative
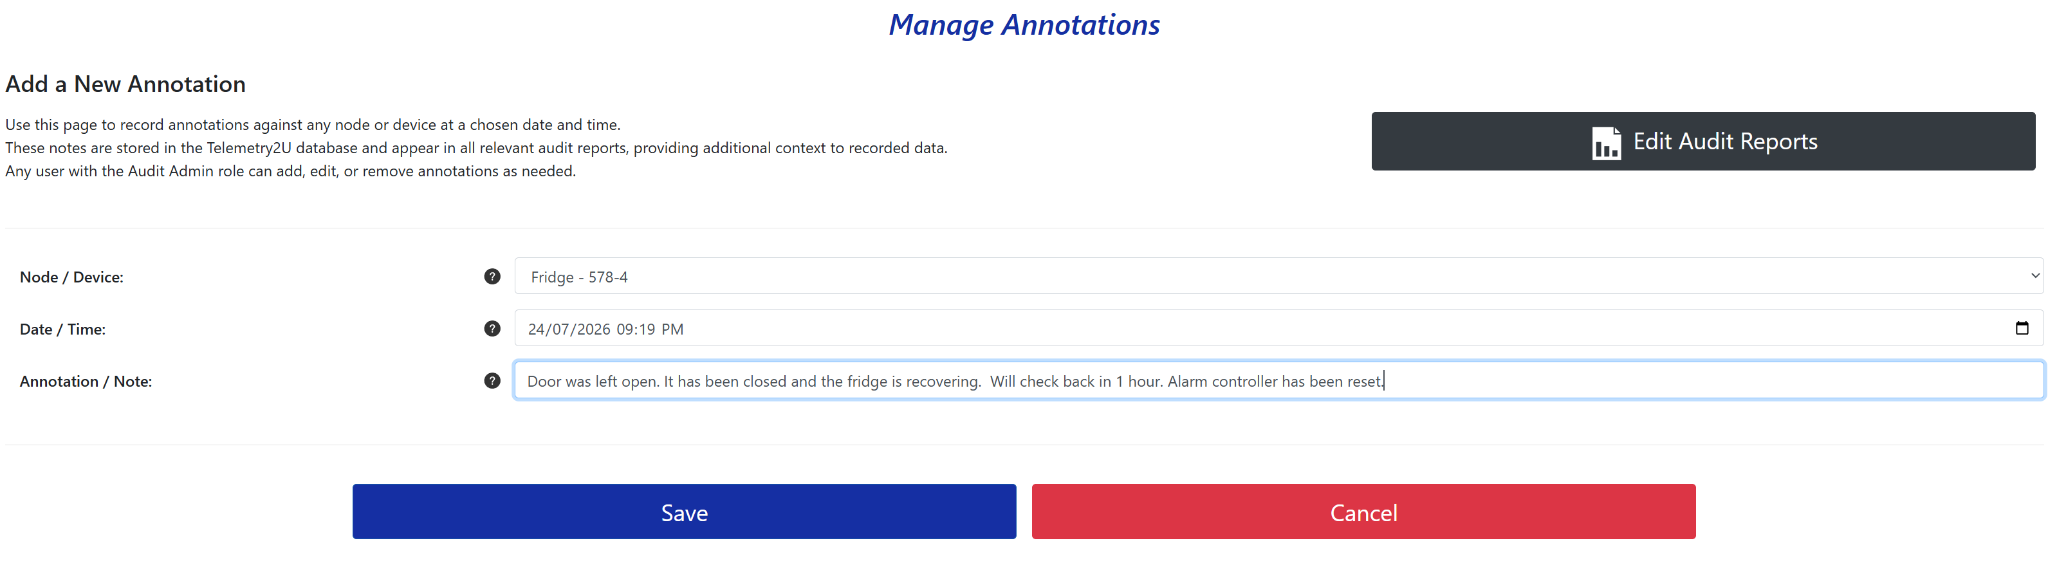
Open Audit Reports > Manage Annotations, select the node and event date and time, enter the note, then select Save. This route is useful when the annotation is being entered independently of Reports.
See How to Add Annotations to Alert Events for the complete annotation workflow.
Complete the Alert Response
Before leaving the platform, confirm that the monitoring event has been assessed and that the shared notification path is ready for the next independent alert.
- Every active dashboard alert has been identified.
- The relevant chart trend has been reviewed.
- The organisation's required response has been decided or initiated.
- The shared alarm controller has been reset after all active alerts were assessed.
- Any continuing, snoozed or disabled condition is known and intentional.
- An annotation has been added where required by the organisation's process.